Dark Pools and DarkFlow are two related yet distinct features within BigShort that provide traders with valuable insights into off-exchange institutional activity. This article will explain what they are, where to find them in the software, and how to interpret them effectively in your trading strategy.
🚀 BigShort is the only platform that displays dark pool trades in real time directly on our charts.
What Are Dark Pools?
Dark pools are private exchanges where large institutional trades take place outside of public markets. These transactions are kept anonymous to avoid market disruption and often reveal critical levels of support or resistance in an asset.
In summary:
-
Purpose : Facilitate large trades without influencing public market prices.
-
Market Significance : Dark pool activity often indicates institutional sentiment, with trades below the price showing support and trades above the price showing resistance or downward pressure.
Where to Find Dark Pool Data in BigShort
BigShort is the only platform that displays dark pools directly on our charts so you can easily spot support and resistance levels. You can analyze dark pool activity in the following sections of the software:
-
FF Segregated: Dark pools shown for any ticker in real time
-
UltraFlow: Dark pools shown for selected indexes in real time
-
DarkFlow: filtered dark pool activity shown for Top 100 tickers by dark pool volume
💡 Tip: Confluence is king!**** Dark pool signals are even stronger when they are supported by other traditional indictors and/or other signals in BigShort like price action, NoF, or SimSearch.
How Dark Pools Appear on Charts
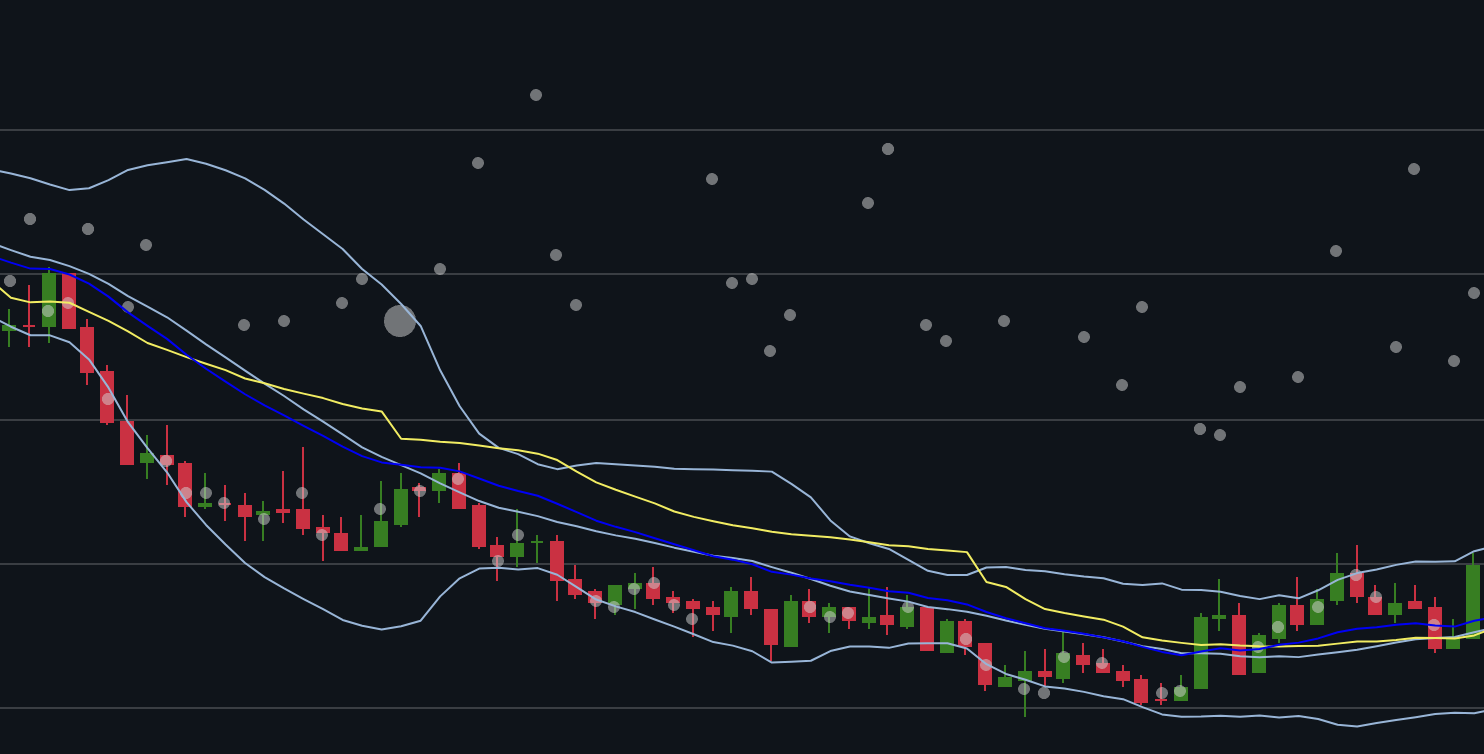
Dark Pool activity is visualized directly on your charts for any ticker :
-
Representation : Gray circles located around or within candlesticks.
-
The size of the circle reflects the volume of shares traded in a five-minute period.
-
Circles dynamically grow or shrink based on real-time activity, much like candlesticks.
-
-
Relative Position :
-
Below the candlestick : Indicates support and often upward price movement.
-
Above the candlestick : Indicates resistance and often downward price movement.
-
Within the candlestick: Generally not a signal either way.
-
Clusters and the "Weight" of Dark Pools
-
Clusters Are Key : One single dark pool is rarely a strong signal. However, clusters of dark pools can indicate significant institutional activity.
-
Size Matters: Dark pools are more powerful signals when they are larger in size or further from the public price.
- It's All Relative: Remember that the size of a dark pool should be judged relative to the historical activity for that ticker. A $20M dark pool might be huge for one ticker, but relatively small for another. Review historical days of the tickers you like to trade to get a sense of scale and a feel for what size dark pool really gets predictive.
- It's All Relative: Remember that the size of a dark pool should be judged relative to the historical activity for that ticker. A $20M dark pool might be huge for one ticker, but relatively small for another. Review historical days of the tickers you like to trade to get a sense of scale and a feel for what size dark pool really gets predictive.
-
Directional Impact :
-
Clusters Below Price Action : Often force the price up , as if the buoyancy of institutional buying is lifting the market.
-
Clusters Above Price Action : Often force the price down , acting like a ceiling or weight pressing the market lower.
-
How to Interpret Dark Pools on Charts
-
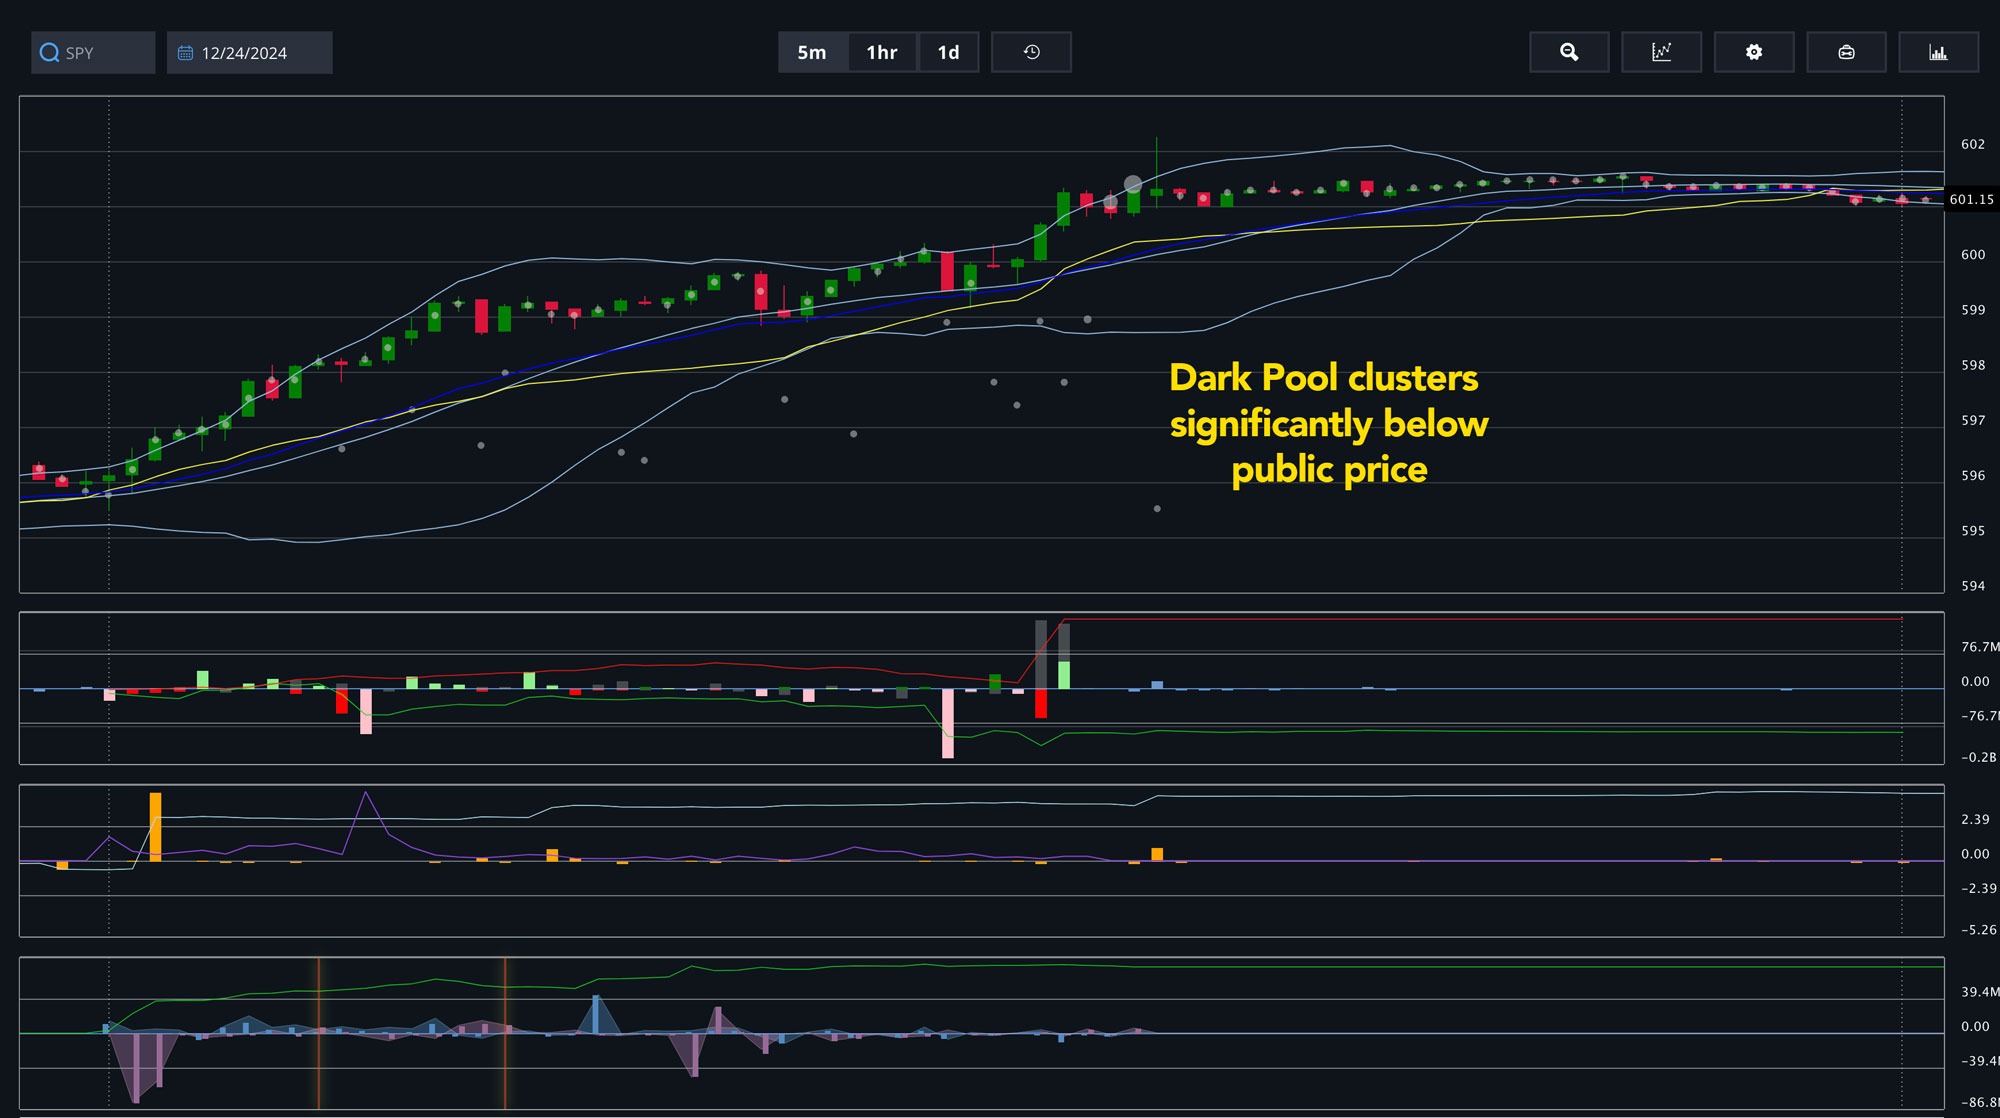
Dark Pools Below Price Action :
-
Large buyers accumulating shares at a discount.
-
Often signals confidence and bullish sentiment.
-
Example: If dark pool activity clusters at $100 and the price is $105, the price may drop to $100 and then rebound.
-
-
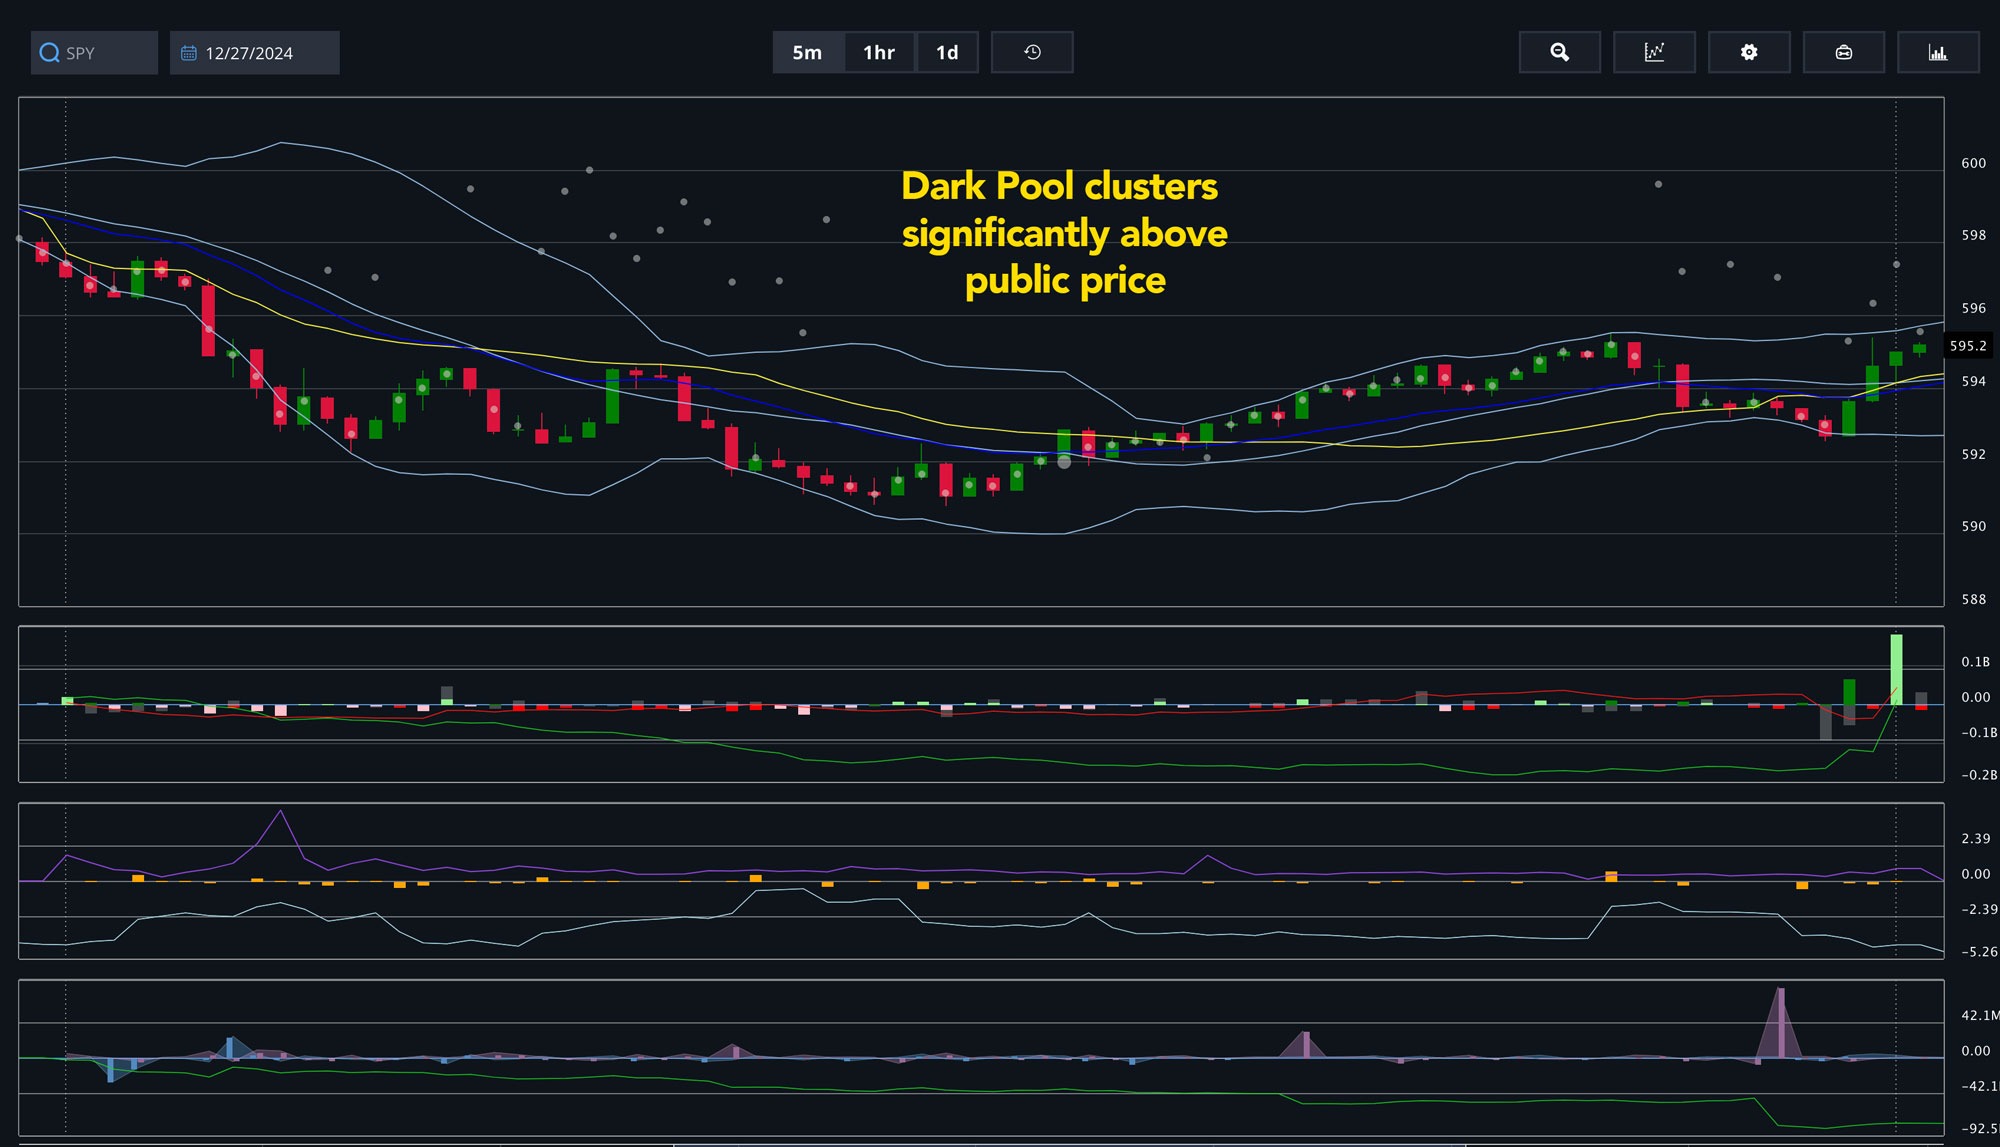
Dark Pools Above Price Action :
-
Large sellers unloading shares at a premium.
-
Often signals supply and bearish sentiment.
-
Example: If dark pool activity clusters at $120 while the price is $115, the price may rise toward $120 but struggle to go higher or eventually fall.
-
What Is DarkFlow?
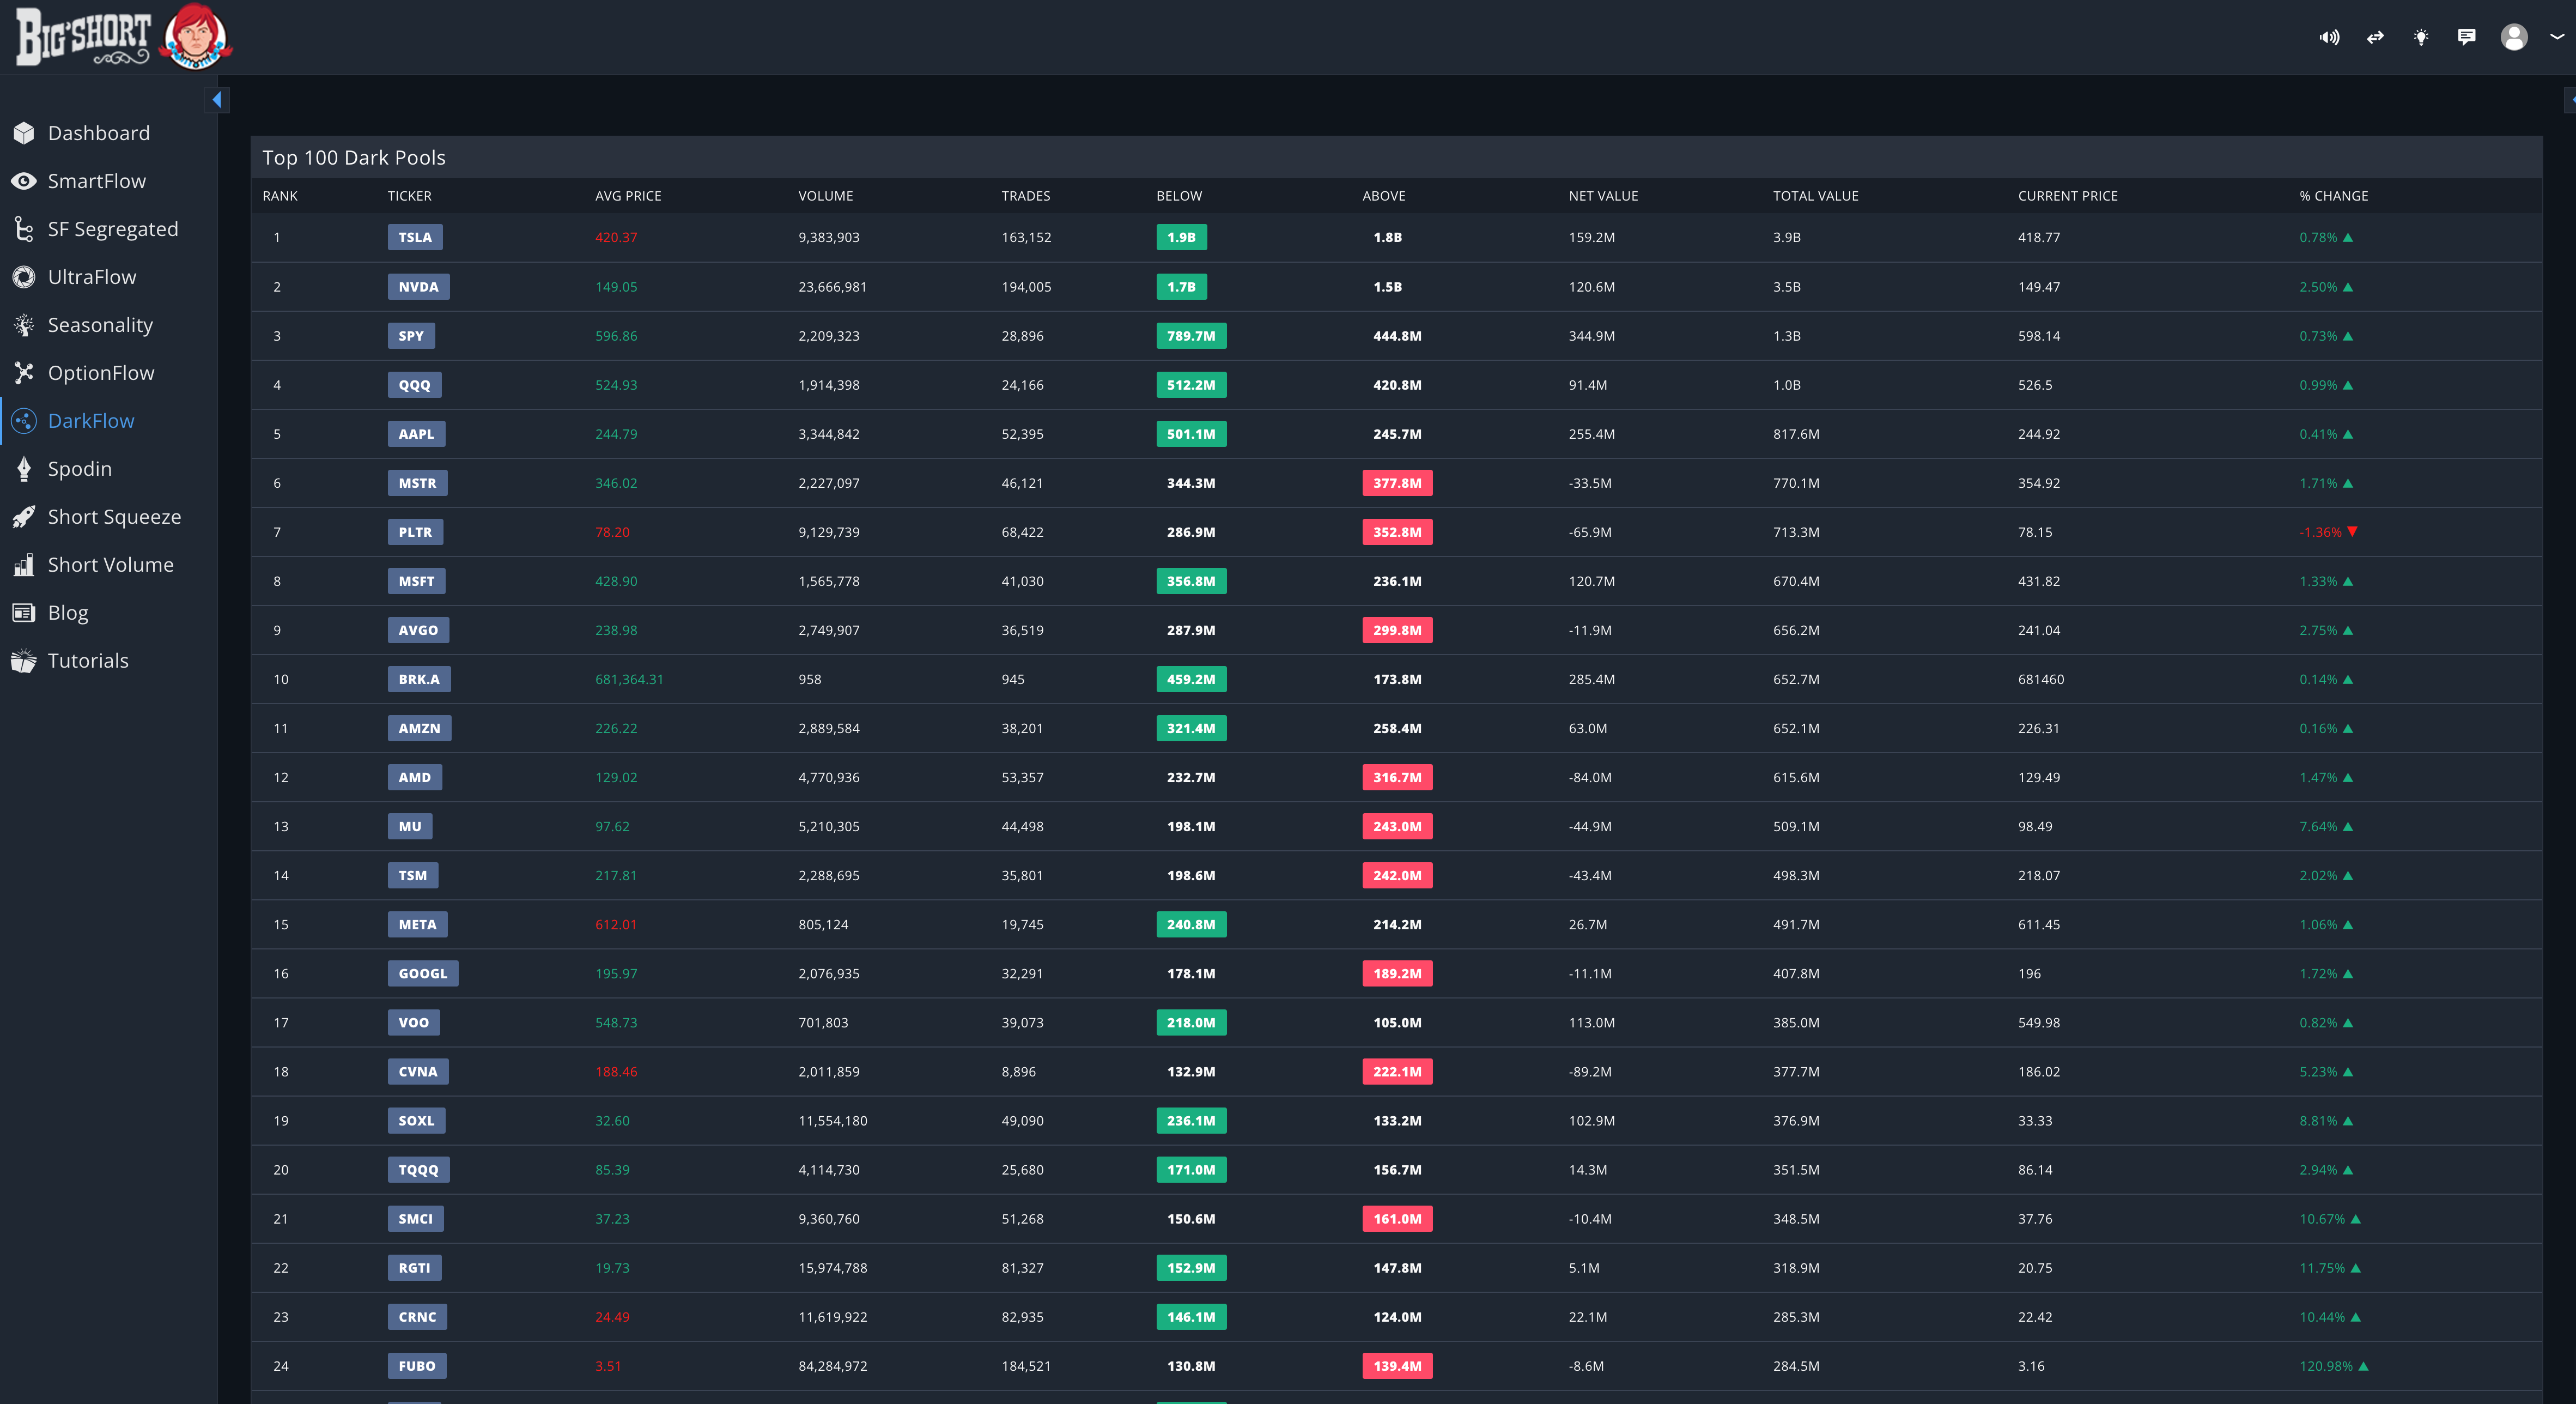
DarkFlow is a discovery tool that provides a ranked list of tickers with the most significant current Dark Pool activity. It helps traders identify where large off-exchange trades are happening across the market, rather than focusing on a specific ticker.
Key Features of DarkFlow
-
Top 100 Tickers : Displays the top 100 tickers with the highest dark pool premiums (volume × price).
-
Filtering Criteria :
- Trades must meet a size threshold or occur at a significant distance from public price action to appear.
- Trades must meet a size threshold or occur at a significant distance from public price action to appear.
-
Interpretation :
-
Dark pool activity above price action : Signals resistance and bearish sentiment.
-
Dark pool activity below price action : Signals support and bullish sentiment.
-
📝 Note : Activity in DarkFlow might not match the dark pool activity you see on the charts in other sections because DarkFlow "filters out the noise" so that only really meaningful off-exchange activity and surfaced. Take this into account in your trading strategy.
How to Use DarkFlow
DarkFlow is ideal for discovering:
-
Tickers with high institutional activity
-
Emerging opportunities based on significant off-exchange trades
-
Market-wide trends in dark pool sentiment
However, DarkFlow does not provide information for tickers outside the Top 100. For deeper analysis of a specific ticker, use the chart-based Dark Pool views in FastFlow, FF Segregated, or UltraFlow.
Pro Tips for Maximizing Dark Pool Data
-
Focus on Clusters : The more dark pools there are, the larger they are, and the further they are from the public price, the more likely they signal significant institutional sentiment.
-
Watch for the "Weight" Effect :
-
Below price : Dark pools can act as a floor, lifting prices higher.
-
Above price : Dark pools can act as a ceiling, pressing prices lower.
-
-
Combine Signals : Dark Pools are even more powerful when used alongside other indicators like NoF. Look for confluence with volume, price action, and other technical tools.
-
Daily Updates : Check DarkFlow regularly for updates to the Top 100 tickers with significant dark pool premiums.