Manipulation
Introduction
Manipulation is one of our most exciting proprietary indicators. We can't disclose exactly how it works under the hood, but this article covers what you need to know to use it. For more, our Discord community is the best place to dig deeper.
Manipulation has its own pane, enabled via the Manipulation checkbox in ⚙️ Settings → Core Flow on both the main chart and the UF Chart.
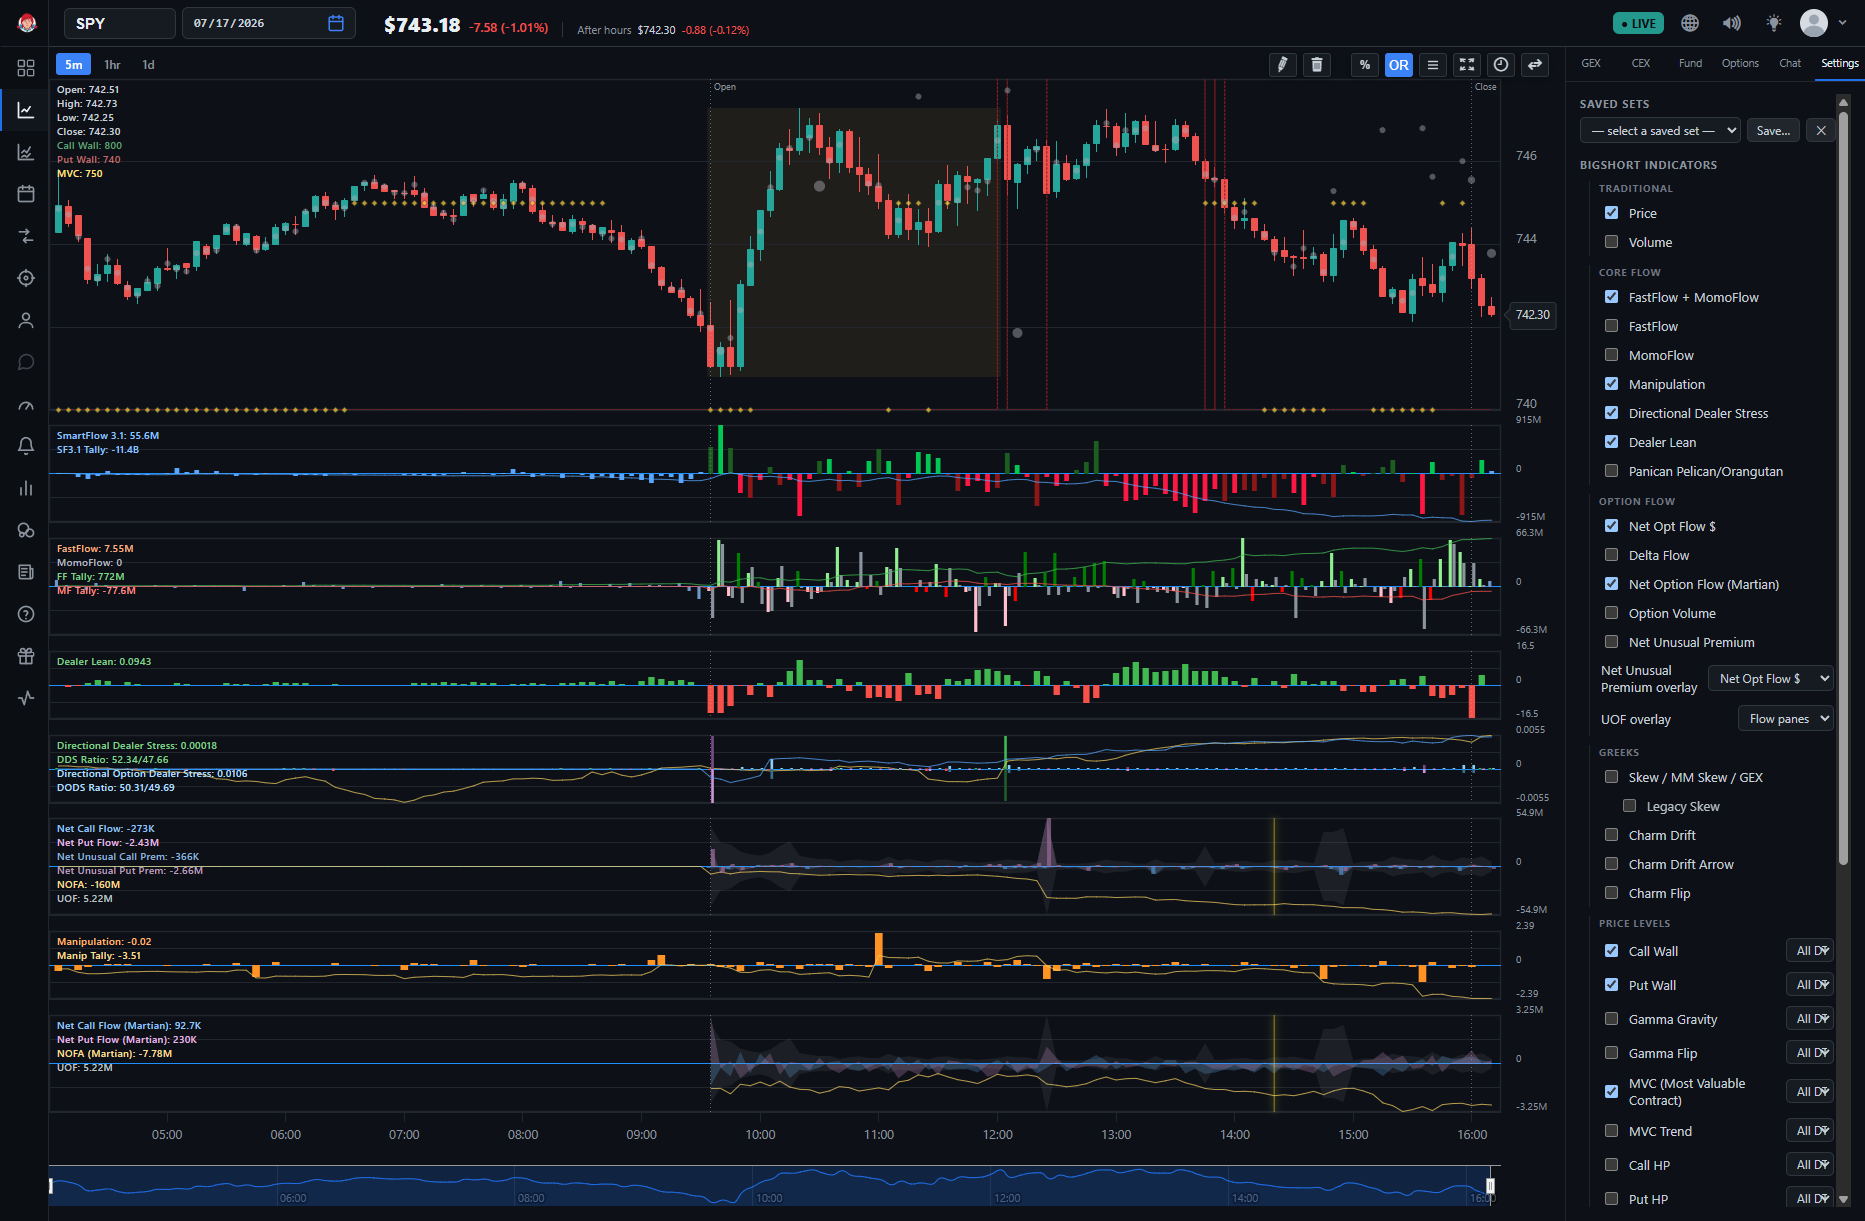
The Manip Tally line is the running session total of the Manipulation bars — the same cumulative-total pattern as the Tally views on BigShort's other panes.
🚨 Warning: Manipulation is not an indicator we recommend for new users and Tae himself only uses it for fast-moving events and during periods of high condensed activity, like FOMC earnings, big news of the approvals, etc.
For more refined versions, available in Elite Memberships, see the M2 Indicator.
Manipulation
As the name implies, Manipulation is an indicator of the extent of potential price manipulation of a stock — the larger the orange bar, the more manipulation is taking place.
The values are relative to the symbol you're analyzing, and there are no fixed units behind them: they come from a proprietary calculation that factors in many variables, with no theoretical maximum. Historical context is your best guide here — pull up past spikes for a symbol like SPY to get a feel for what counts as "high" or "low" for that particular ticker.
💡 Tip: During periods of high, condensed activity for a stock (FOMC, earnings, big news, FDA approvals, etc.) Manipulation often acts as a. inverse indicator. So if there's big news or an event and lots of volume and big MomoFlow bars and you see a large M Bar pointing down, that's a bullish signal, while a large M Bar pointing up is a bearish signal.