Understanding FastFlow and MomoFlow Indicators
FastFlow (FF) and MomoFlow (MF) are two core BigShort indicators that split intraday order flow into two speeds: the slow, human-driven side of the market and the fast, algorithmic side. Once you can tell the two apart, a lot of price action that otherwise looks random starts to make sense.
What Is MomoFlow?
MomoFlow (sometimes called "momo" or "shadow bars" by our users) represents emotional, discretionary buying and selling activity. It includes orders from retail traders and "blocky" orders from larger investors, referred to by our founder as "dumb big money." This flow is driven by human speculation about price direction, making it slower and more deliberate compared to automated strategies.
💡 Tip: Since MF is a proxy for dumb money, it is usually an inverse indicator. If you see a big shadow bar pointing down, that means momo is dumping, and market makers are buying the dump. Think of it as a seesaw: the more the momo majority is on one side, the less room there is for a further move in that price direction, and the more incentive market makers have to take price in the opposite direction.
MomoFlow behaves differently depending on the ticker: it's an inverse indicator for many names, but a handful of tickers actually seem to get driven by momo activity instead of fading it. SPY is the clearest case — MomoFlow is usually a reliable inverse read there, except on Mondays, when it flips and tends to drive the day's action instead (the community calls these "Momo Mondays"). In the short term MomoFlow can be genuinely predictive, especially for SPY, and the signal gets stronger the more shadow bars you see pointing the same direction in a row.
Two things worth keeping in mind: on Momo Mondays, check that other indicators like NOF aren't pointing the opposite way before you trust the momo read, and don't assume every ticker behaves like SPY — pull up historical charts for the names you actually trade to see how they respond.
💡 Tip: Price movement on some tickers is much more driven by MomoFlow activity than others. Make sure you are reading our Member's Only Discord to benefit as the community discovers these opportunities.
What Is FastFlow?
FastFlow (FF) was formerly called SmartFlow. (Note: BigShort's Elite indicators SmartFlow 3 (SF3) and SmartFlow 3.1 (SF3.1) are separate, different indicators — not this FastFlow.)
FastFlow reflects algorithmic, automated trading activity: high-frequency strategies, rotational strategies, and hedging mechanisms run by market makers, mega funds, and other sophisticated participants. It's formulaic and emotion-free, driven by predefined rules rather than human discretion — which is also why it can carry "fake" or manipulative activity aimed at nudging price discovery in a particular direction.
💡 Tip: Disregard FastFlow, especially new users. It's algorithmic and too fast to front-run. Instead, watch the MomoFlow—Momo trades with human reaction times, making them easier to track.
Reading FastFlow and MomoFlow Charts
The easiest way to see FastFlow and MomoFlow is on the main chart (app.bigshort.com/chart/SPY): open ⚙️ Settings and, under Core Flow, enable FastFlow and MomoFlow individually. Each gets its own pane, separating the two flows for ease of analysis.
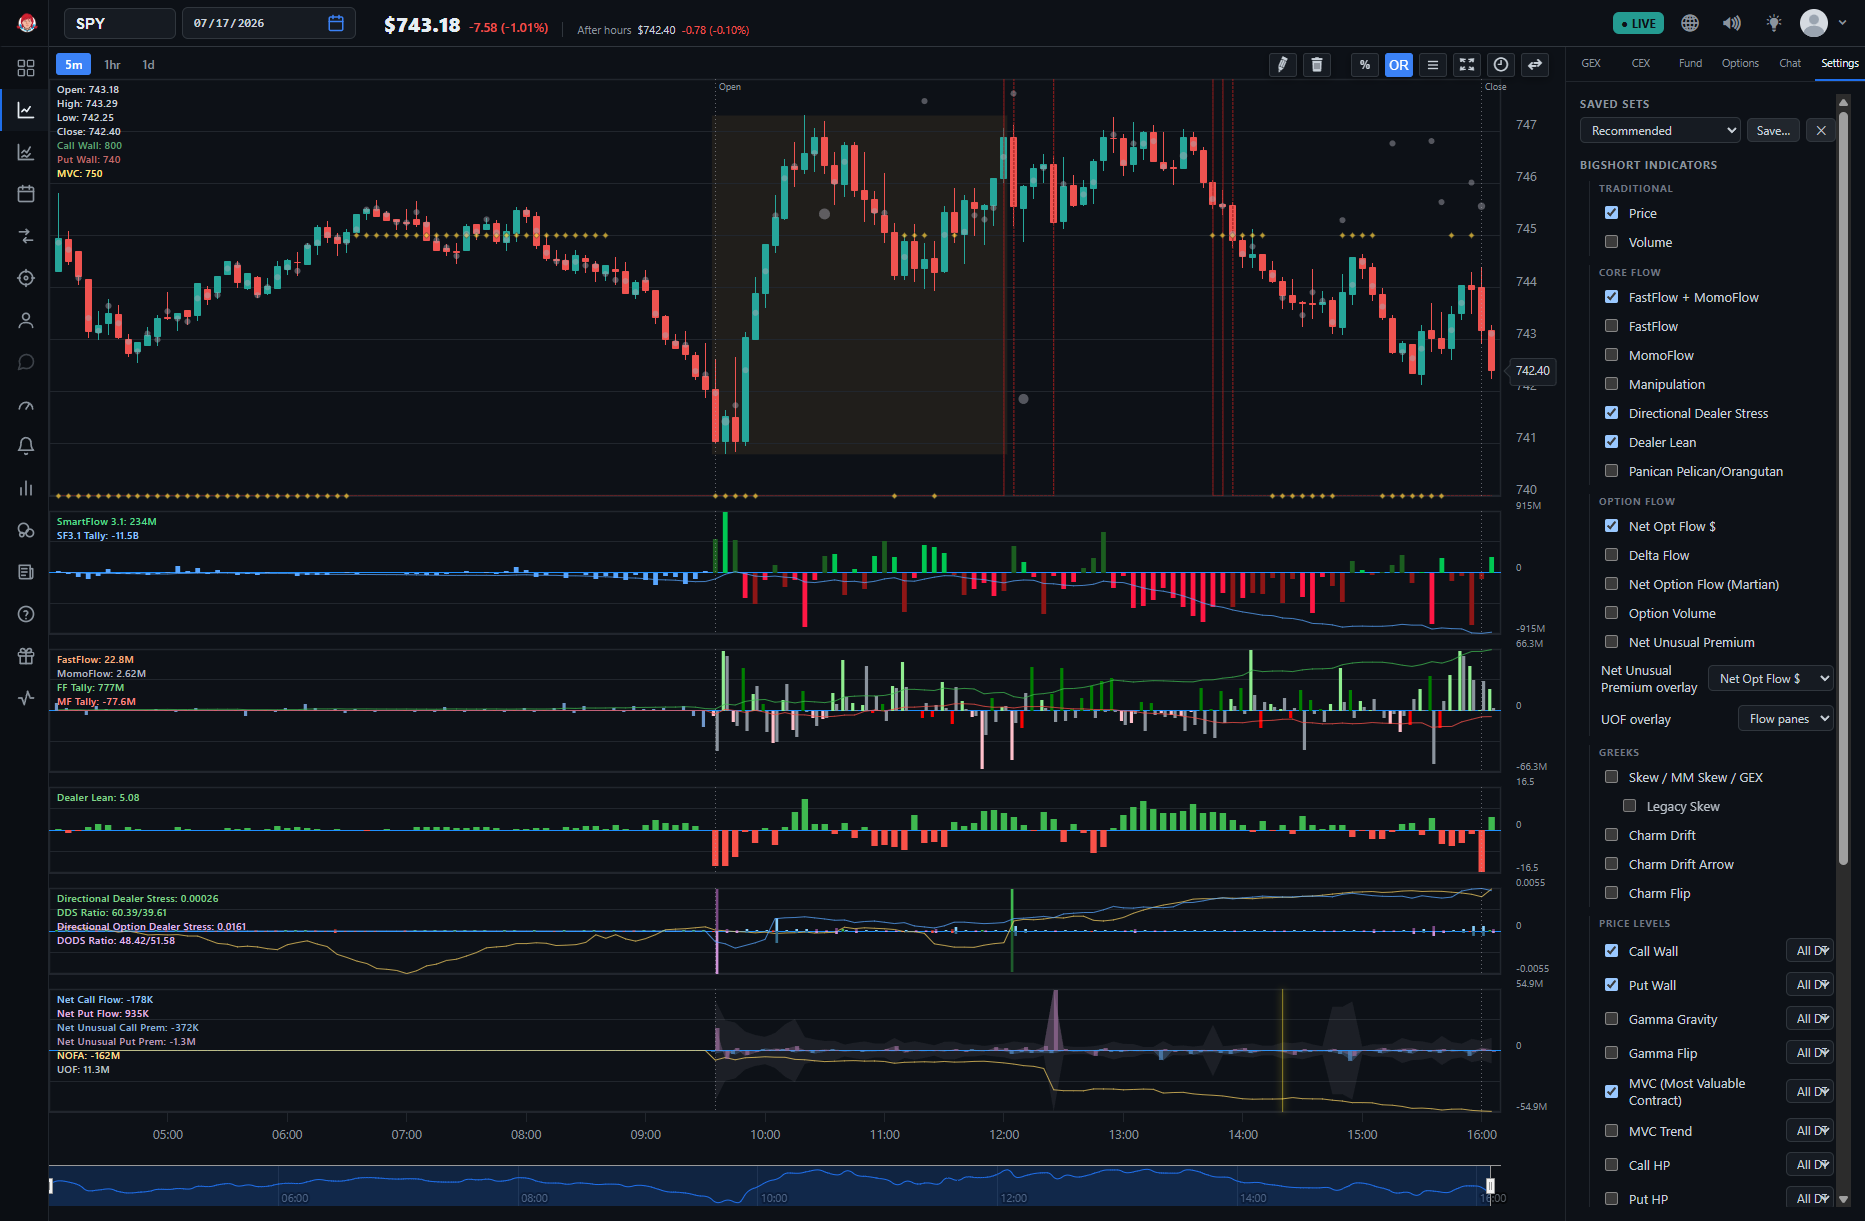
The FastFlow pane
As with other indicators in BigShort, bars pointing up denote buying and bars pointing down denote selling.
FastFlow's bar color reflects whether it's aligned with MomoFlow:
-
Lime: FastFlow and MomoFlow are both buying (aligned) — a single solid bar, no grey MomoFlow shadow.
-
Pink: FastFlow and MomoFlow are both selling (aligned) — a single solid bar, no grey MomoFlow shadow.
-
Green, with a grey shadow bar on the opposite side of the zero line: FastFlow is buying, but MomoFlow is selling (not aligned).
-
Red, with a grey shadow bar on the opposite side of the zero line: FastFlow is selling, but MomoFlow is buying (not aligned).
The green line in this pane is the accumulation tally of the activity, allowing you to clearly see the direction and overall behavior of the day.
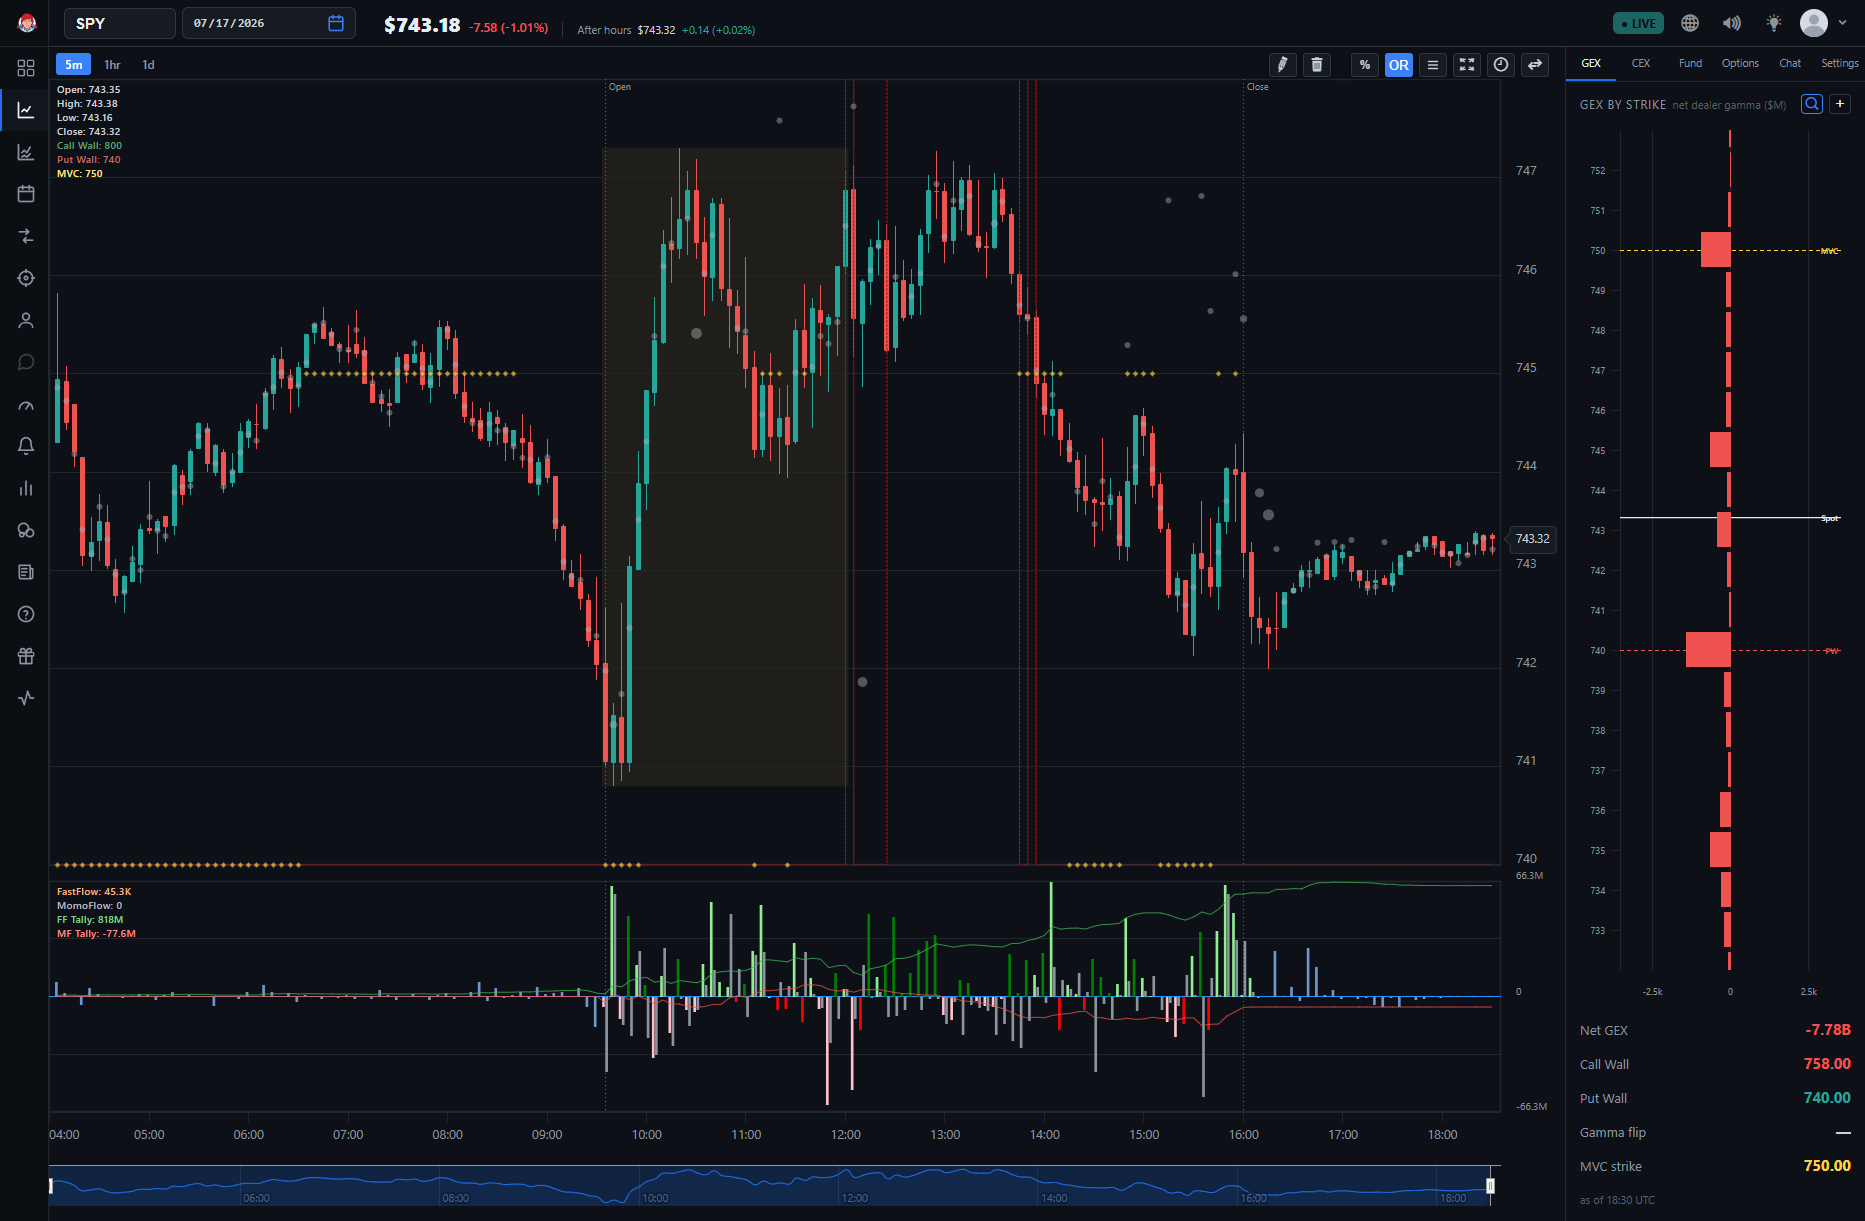
🔎 Looking Deeper: Just because FastFlow and MomoFlow are pointing the same direction doesn't mean their levels are the same. FF could be buying a little while MF is buying a lot, or visa versa.
The MomoFlow pane
Here also, bars pointing up denotes buying and bars pointing down denotes selling. These bars are always grey, leading to their nickname among our users: Shadow Bars.
The red line in this pane is the accumulation tally of the activity, allowing you to clearly see the direction and overall behavior of the day.
💡 Tip: Confluence is king! When Momo signals agree with Dark Pool or NOF, that's powerful. When all three agree that can be a very reliable signal of upcoming price movement.
The combined FastFlow + MomoFlow pane
You can also view FastFlow and MomoFlow combined into a single pane: in ⚙️ Settings, enable FastFlow + MomoFlow instead of the two individual checkboxes.
The color coding in the combined pane is the same as in the separated view.
-
Lime Bar: FastFlow and MomoFlow are both buying (aligned)
-
Pink Bar: FastFlow and MomoFlow are both selling (aligned)
-
Green Bar + grey shadow bar (opposite side of the zero line): FastFlow is buying, MomoFlow is selling (not aligned)
-
Red Bar + grey shadow bar (opposite side of the zero line): FastFlow is selling, MomoFlow is buying (not aligned)
-
Green Line: accumulation of FastFlow
-
Red Line: accumulation of MomoFlow
Since these graphs are combined, you can directly see the differences in value for FastFlow and MomoFlow — mouse over any bar for the exact numbers in the readout panel. Like in this example:
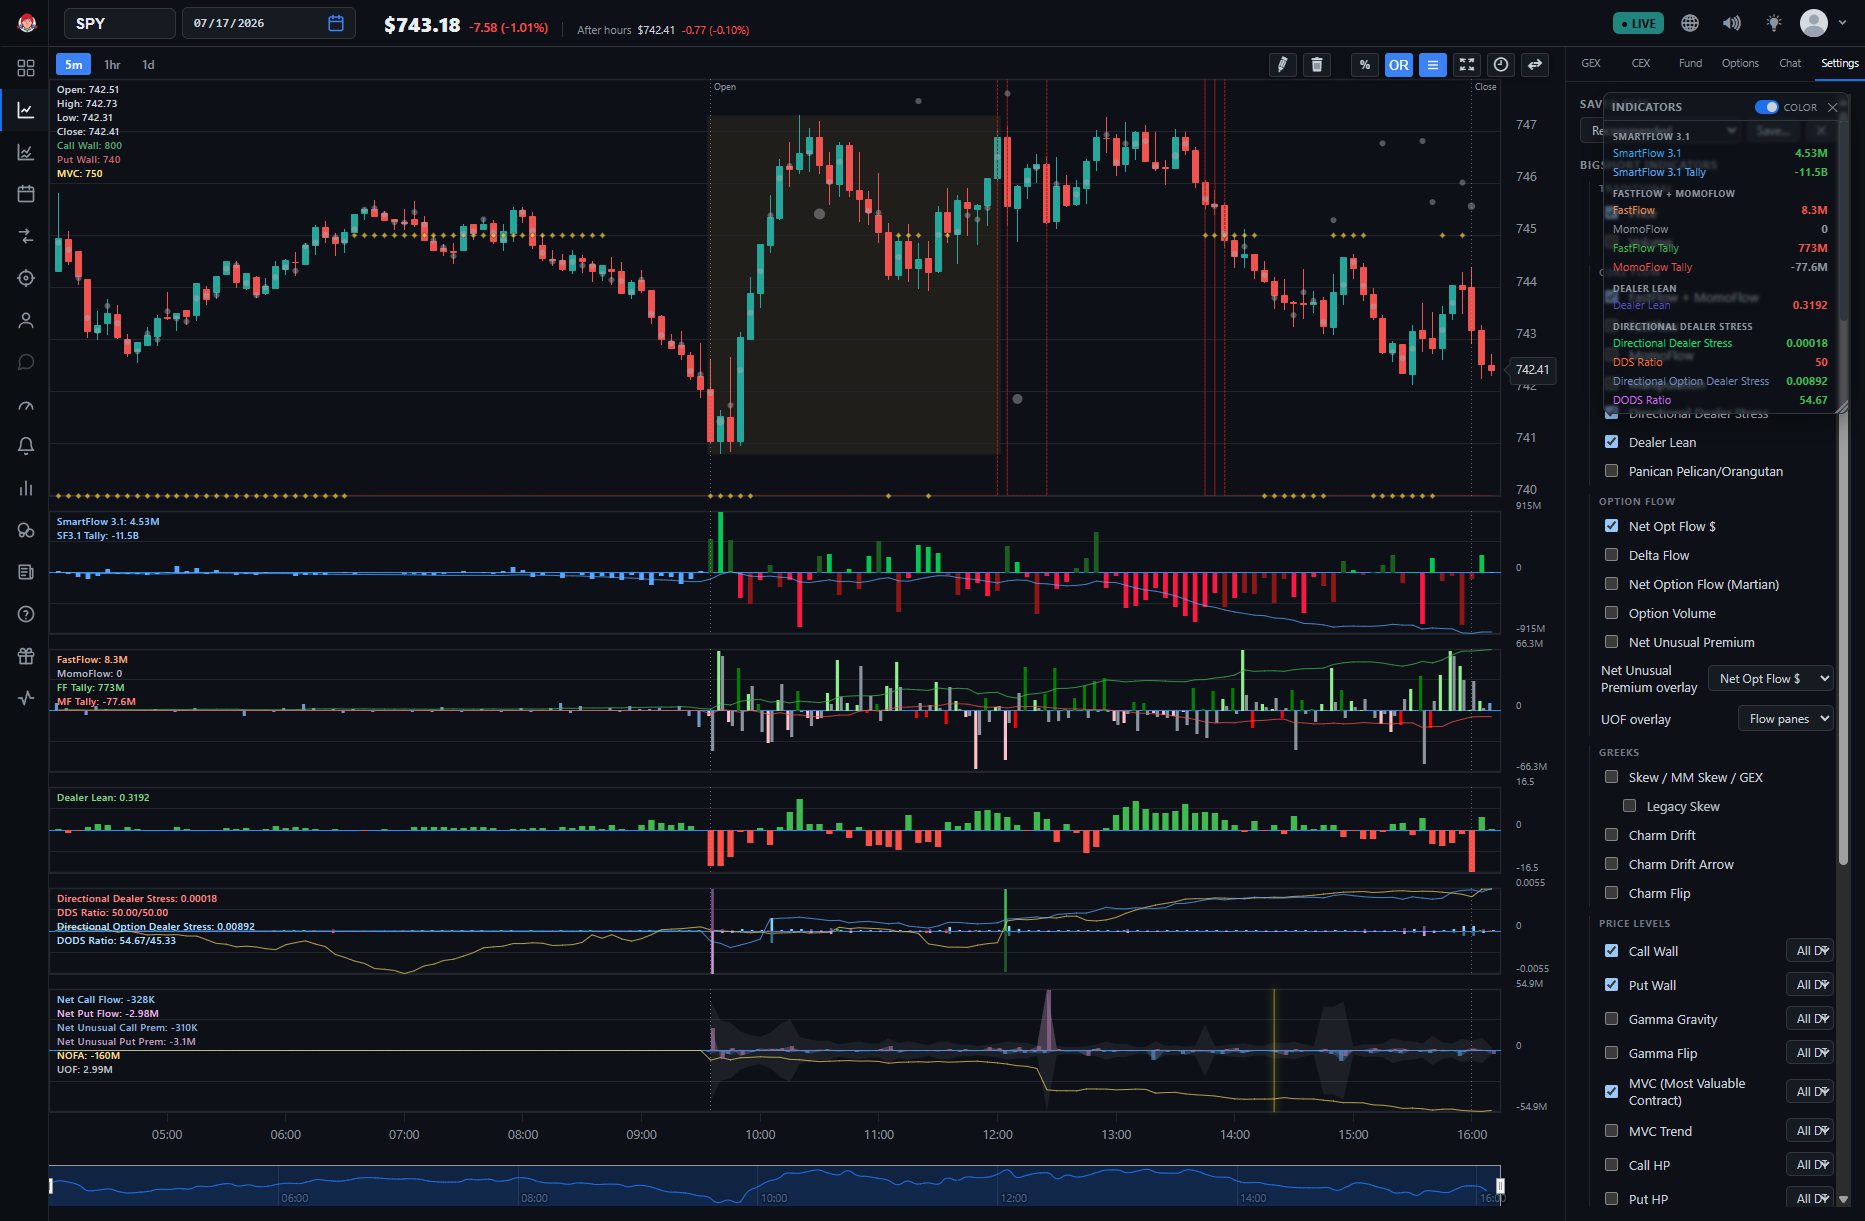
In the last bar here, both MF and FF are buying — a solid lime bar, since they're aligned — but the readout panel shows MF's value is significantly larger than FF's, revealing that MomoFlow is doing most of the buying even though the merged bar color alone doesn't show that difference.
💡 Tip: If you mouse over any bar, you can see the exact values of the chart data in the indicator values readout panel (draggable and resizable), shown at the top-left of the chart by default.
Scaling Warnings for FastFlow and MomoFlow
When analyzing FastFlow and MomoFlow charts, watch out for the autoscaling feature. Autoscaling adjusts the graph's scale to the data in whatever timeframe you've selected, which can make certain bars look disproportionately large — that doesn't always mean a significant market move, it may just mean the bar is large relative to other activity in that specific window. Always compare volume to the ticker's historical values rather than trusting the graph's visual scale alone, since a bar that looks huge on-screen can turn out to be a minor move once you check it against broader history.
MomoFlow Exhaustion
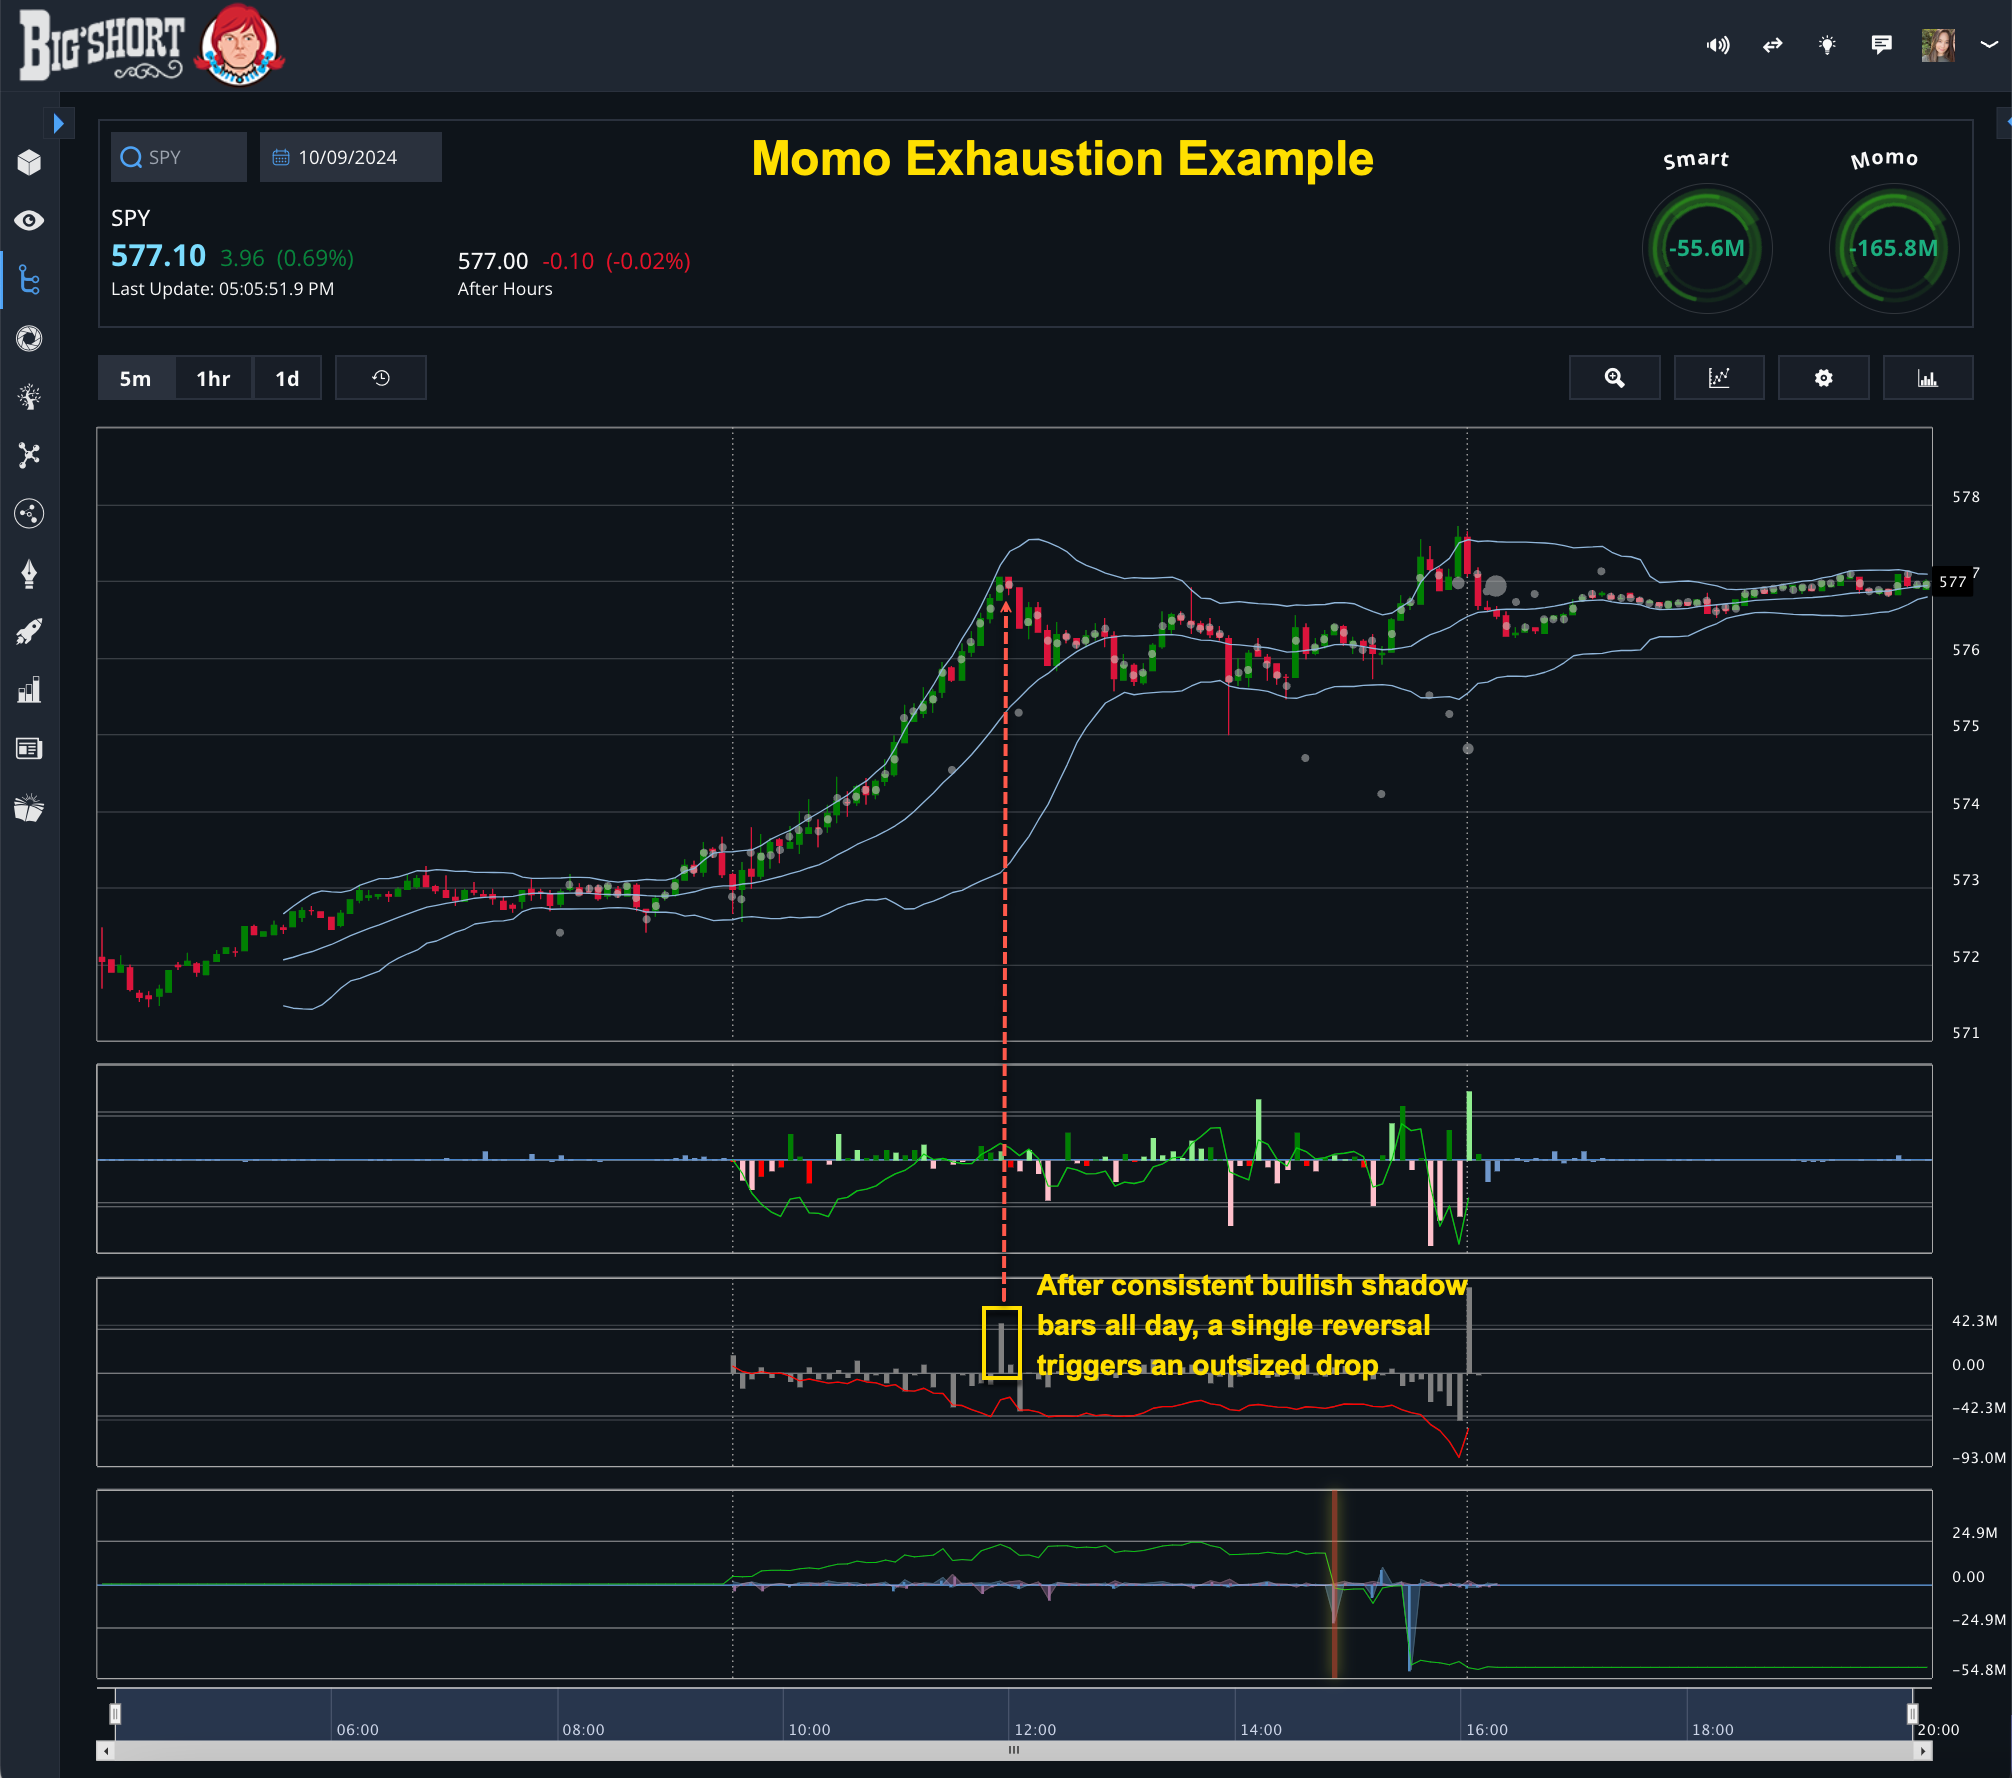
One important theory to understand when using MomoFlow is the concept of exhaustion. When MomoFlow trends hard in one direction for an extended period, it can signal that the market is becoming overextended. A reversal in the opposite direction often results in an outsized move.
This occurs because when one side of the market becomes too crowded, a smaller volume of trades in the opposite direction can trigger a significant reversal. Think of it like two opponents pushing against each other: when one side exerts all their strength and becomes tired, the other side can easily push the other with much less effort.
Watch for sustained trends in MomoFlow as a sign you may be approaching an exhaustion point, and be ready for a sharp reversal once the indicator starts shifting the other way. Historical charts are the best way to learn how exhaustion tends to play out for a specific ticker.
The screenshot below was captured in BigShort's v1 interface; the setup and mechanics it shows are unchanged in today's app.
Balancing FastFlow and MomoFlow
Both FastFlow and MomoFlow are essential for comprehensive market analysis. MomoFlow helps you understand human sentiment and discretionary moves, while FastFlow offers a window into algorithmic and potentially manipulative activities. Together, they provide a balanced view of market dynamics.
As BigShort's founder often notes, neither flow tells the whole story on its own. Use them alongside other BigShort indicators, such as NOF and dark pool data, to form a complete picture of market activity.