Dealer Lean, Directional Dealer Stress, and Panican: Reading Dealer Positioning and Crowd Urgency
Price is the surface. Underneath it, dealers are constantly managing inventory they never wanted, and the crowd panics when a move gets away from it. Dealer Lean — one of Tae's most important and closely watched indicators on the platform — reads which side of that inventory dealers are leaning toward, and it tends to turn before price does. BigShort pairs it with Directional Dealer Stress (DDS), a read on how much pressure dealers are under, and Panican Pelican/Orangutan, a panic-grade urgency detector for the crowd.
This guide covers Dealer Lean, Directional Dealer Stress (DDS), Directional Option Dealer Stress (DODS), and Panican Pelican/Orangutan. They live together because they all answer the same underlying question — what is the smart-money plumbing, and the panic-prone crowd, actually doing right now? — from a few different angles.
For the deeper why behind dealer behavior — why market makers hedge and manage inventory at all — read the Gamma, Dealer Hedging, and Why Price Reacts at Options Levels master guide first. This article is about reading the positioning and stress that hedging creates, not re-deriving the mechanism.
Dealer Lean
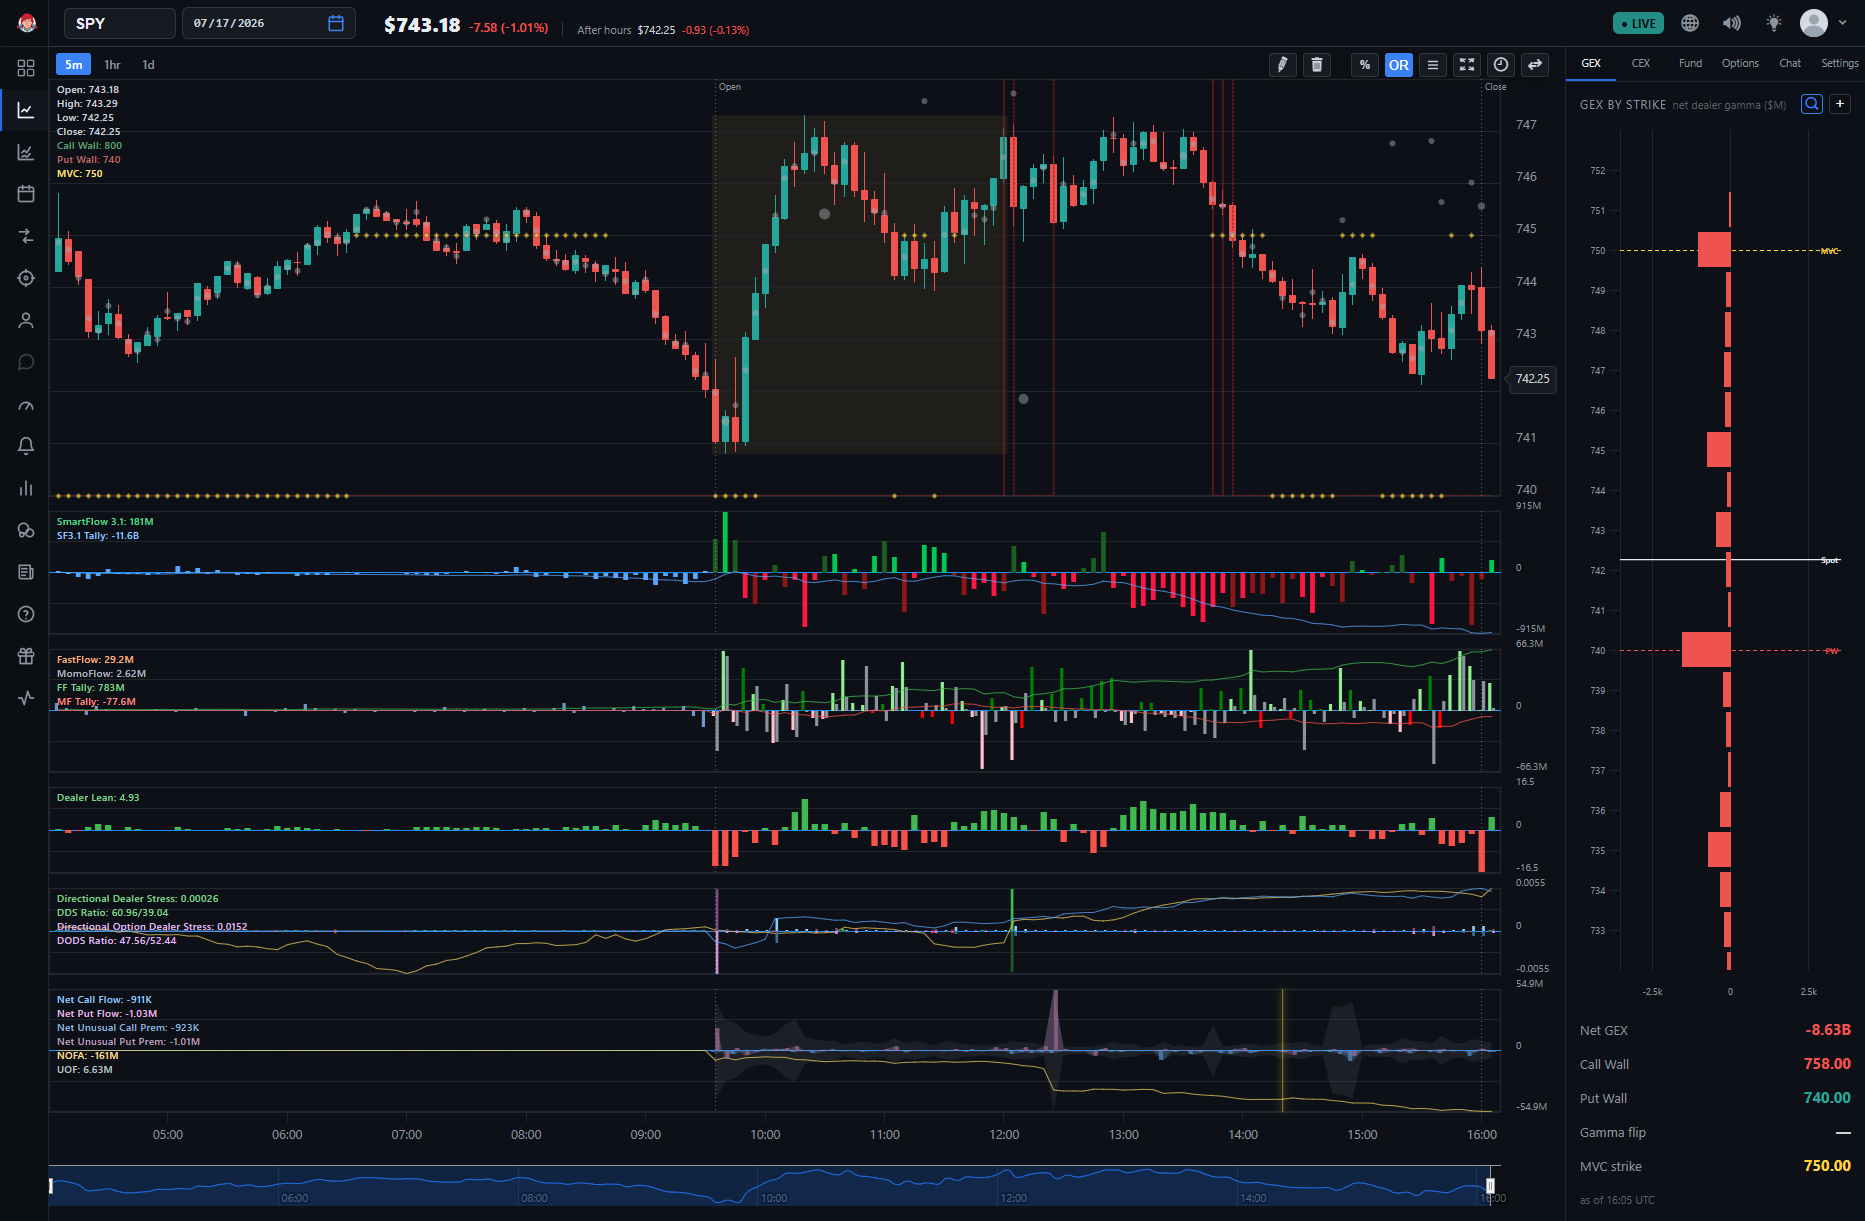
Dealer Lean shows which side of the market equity dealers are leaning toward as they manage inventory.
It draws as red, downward-pointing bars and green, upward-pointing bars:
- Green (upward) bars = a positive lean — dealers leaning toward the sell side.
- Red (downward) bars = a negative lean — dealers leaning toward the buy side.
How to read it
Dealers tend to be positioned ahead of where price eventually goes, so the price read simply follows the direction of dealer pressure — not the bar's color read the way you'd naively read a red/green candle:
- Red bars have tended to lead toward breakouts and upside moves.
- Green bars have tended to lead toward downside moves.
- A transition from red to green, or green to red, can mark an inflection point — often before price itself turns.
Here's an example from Tae, from early one morning: SPY chart, June 30. Jeff also put together an annotated walkthrough on Discord showing the same read in more detail.
🔎 Looking closer: Size matters as much as color. The pane plots a percentile line, and small bars near the open shouldn't carry the same weight as bars that reach it. Watch the trend of the bars too, not just their color — if green bars start shrinking through the session, that's a bullish tell even before the color flips, and the same logic runs in reverse for red.
💡 Tip: Treat the directional read cautiously around FOMC and other event-driven days, when dealers aren't fully in control of positioning the way they usually are.
Directional Dealer Stress (DDS)
Directional Dealer Stress measures how much inventory pressure equity dealers are under on a given bar, and which side that pressure is coming from.
- Green-dominant bars = dealers backing away from the upside.
- Red-dominant bars = dealers backing away from the downside.
- Bar height = the overall stress level — a tall bar means dealers are under real pressure, a short bar means they're comfortable.
DDS also plots a running tally (sometimes labeled Ratio) — a cumulative session total of the stress readings, the same running-total pattern as the Tally views on other BigShort panes.
Enabling Directional Dealer Stress also draws its options-side counterpart, Directional Option Dealer Stress (DODS), in the same pane as sky/orchid columns — there's no separate checkbox for it.
DDS is a newer, less-tested read than Dealer Lean. Use it as context for how much pressure dealers are under, not as a standalone directional signal.
Panican Pelican / Orangutan
The Panican pair is a panic-grade urgency detector — it flags the moments when trading stops being orderly and turns into chasing or capitulation.
- Panican Pelican tracks urgent stock trading: chase buying and capitulation selling — the crowd rushing in or bailing out.
- The Orangutan line adds the options-side equivalent, expressed in stock-equivalent terms so it lines up with the stock reading.
For both, the sign tells you the direction of the urgency:
- Positive = urgent buying.
- Negative = urgent selling.
BigShort has described Panican as experimental and crowdsourced — still being evaluated for how predictive it is — so read it as directional color on crowd behavior rather than a confirmed signal on its own.
🔎 Looking closer: This is a different animal from Dealer Lean and DDS above. Those read the dealers; Panican reads the crowd at its least composed — the chase-and-capitulate behavior that tends to show up at emotional extremes.
How to Use These Indicators
These indicators are context and confirmation, not standalone entry signals. A sensible way to read them together:
- Start with Dealer Lean. It's the one to weight most heavily — watch the color (red vs. green) and, especially, the transitions between them, which tend to mark inflection points ahead of price.
- Weigh the size, not just the color. Larger bars near the pane's percentile line carry more weight than small bars near the open; watch for bars shrinking through the session as an early read on fading momentum.
- Layer in dealer stress. Tall DDS / DODS bars mean dealers are under real pressure; short bars mean they're comfortable. Color tells you which side that pressure is on.
- Watch for panic. A spike in Panican Pelican / Orangutan marks urgent, emotional flow — chase buying or capitulation selling. Extremes here often coincide with the exhaustion points where moves run out of fuel.
- Confirm with flow and levels. Combine these reads with real-time order flow and the dealer-hedging levels, and go easy on the directional read around FOMC and other event-driven days. Confluence is king.
💡 Tip: These panes pair naturally with Manipulation (price moves that aren't backed by genuine flow) and with FastFlow and MomoFlow (the aggressive-algo and broad-crowd order flow). Dealer positioning and crowd panic tell you who is under pressure; the flow indicators tell you what they're doing about it.
Where to Find Them
All four indicators live under ⚙️ Settings → Core Flow on the main chart (app.bigshort.com/chart/SPY). They are main-chart indicators: on the UF Chart, Dealer Lean and Directional Dealer Stress appear in the settings panel but are disabled, and the Panican controls are absent.
Enable Dealer Lean for its pane, Directional Dealer Stress to draw the DDS and DODS pane together, and Panican Pelican/Orangutan for the urgency detector. The default chart already shows the Dealer Lean and DDS/DODS panes beneath price.
Availability, as of 2026-07-20: Dealer Lean and Directional Dealer Stress are currently Standard-tier (free) indicators. BigShort has indicated it plans to move them to Elite — check the app for current access before assuming they'll stay free.
- Gamma, Dealer Hedging, and Why Price Reacts at Options Levels — the why behind dealer inventory management
- Manipulation — price movement that isn't supported by genuine flow
- FastFlow and MomoFlow — the aggressive-algo and broad-crowd order flow beneath the tape
- Net Option Flow — real-time options sentiment to confirm what dealers and the crowd are reacting to