Gamma, Dealer Hedging, and Why Price Reacts at Options Levels
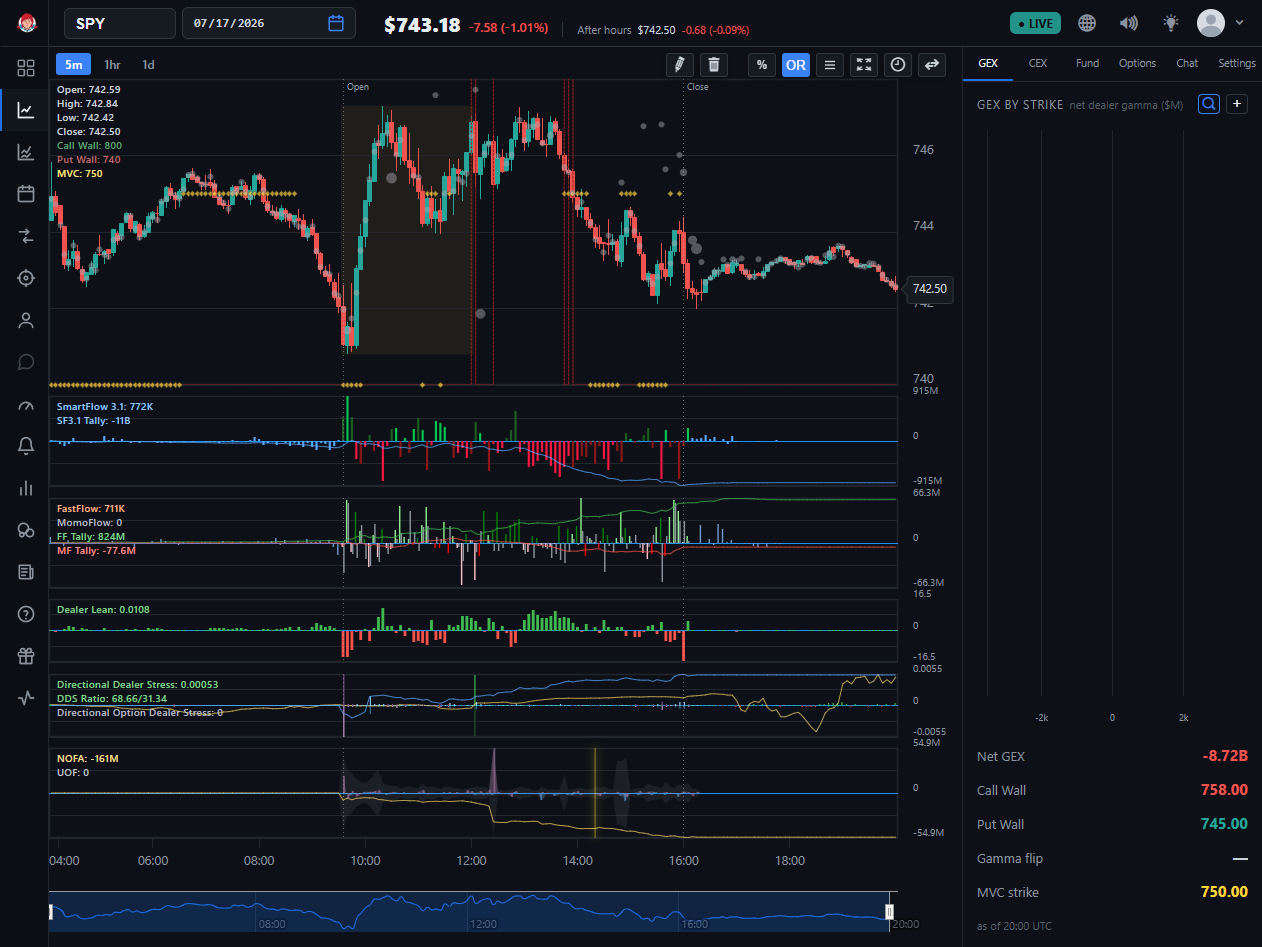
BigShort draws a handful of horizontal levels on your chart — the Call Wall, Put Wall, Gamma Flip, Gamma Gravity, and MVC — plus a color-coded GEX map down the side. Traders notice that price often stalls, reverses, or gets "pinned" at these lines. This is not coincidence, and it is not magic. It is the mechanical footprint of dealer gamma hedging. This guide explains the mechanism first, then shows how each BigShort level reads it.
Who Dealers Are, and Why They Hedge
Every time you buy or sell an option, someone takes the other side. Overwhelmingly, that someone is a market maker (a "dealer"). Dealers are not trying to bet on direction — they earn the spread and aim to stay delta-neutral, meaning their net directional exposure is roughly zero.
But options don't have constant delta. As the underlying moves, an option's delta changes, which pushes the dealer's book away from neutral. To get back to neutral, the dealer must trade the underlying — buying or selling shares (or futures) to offset the drift. That hedging flow is real order flow hitting the tape, and when a lot of open interest is concentrated at particular strikes, it becomes large enough to shape price itself.
Gamma: the Rate at Which Delta Changes
- Delta is how much an option's price moves per $1 move in the underlying — effectively the option's share-equivalent exposure.
- Gamma is the second-order greek: the rate at which delta itself changes as the underlying moves.
High gamma means delta shifts quickly, so the dealer has to re-hedge quickly and often. The critical question for the whole market is not any single dealer's book but the net position of dealers in aggregate: are they, as a group, long gamma or short gamma?
Long-Gamma Regime — Dampening
When dealers are net long gamma, their hedging works against the move:
- Price rises → their delta grows → they sell the underlying to stay neutral.
- Price falls → their delta shrinks → they buy the underlying to stay neutral.
Selling into strength and buying into weakness suppresses volatility. Moves get sold, dips get bought, and price tends to grind quietly or "pin" near strikes with heavy gamma. Calm, mean-reverting tape is the long-gamma signature.
Short-Gamma Regime — Amplifying
When dealers are net short gamma, the same hedging runs with the move:
- Price rises → they must buy the underlying to stay neutral.
- Price falls → they must sell the underlying to stay neutral.
Now hedging adds fuel: buying into strength and selling into weakness amplifies the move. This is the regime behind fast, trending, "gappy" days and air-pocket selloffs. Volatile, momentum tape is the short-gamma signature.
The boundary between these two worlds is the single most important level on the chart — and BigShort draws it for you as the Gamma Flip.

The Volatility Surface, Briefly
Dealer positioning doesn't live at one strike — it's spread across the whole volatility surface: every strike and every expiry, each with its own implied volatility. The shape of that surface (how demand for downside protection versus upside exposure is priced — the skew) shapes where dealer gamma concentrates. BigShort summarizes the directional-pricing side of the surface in its Options Skew indicators; this article focuses on the gamma that surface produces and the levels it creates.
Why Price Reaches Levels, and Why It Reacts at Them
Two distinct behaviors fall out of the mechanics above:
- Reaching (the magnet effect). In a long-gamma regime, dealer hedging continuously nudges price back toward the strikes carrying the most gamma. Price is drawn toward the center of positioning — especially into expiration, when gamma is highest and the pull is strongest. This is classic pinning.
- Reacting (support and resistance). At a wall — a strike stacked with dealer gamma — the hedging response is large and one-sided enough to absorb the move. A Call Wall tends to cap rallies; a Put Wall tends to catch selloffs. When price finally pushes through a wall, the hedging can flip from absorbing the move to chasing it, which is why breaks of these levels sometimes accelerate.
Neither behavior is a guarantee — positioning shifts intraday and levels can break. They are tendencies created by hedging pressure, best used as context alongside real-time flow, not as standalone triggers.
BigShort's Gamma Levels, Mapped to the Mechanism
You'll find these under ⚙️ Settings → Greeks (the Skew / MM Skew / GEX pane) and ⚙️ Settings → Price Levels, and in the GEX side panel.
GEX (Net Gamma Exposure)
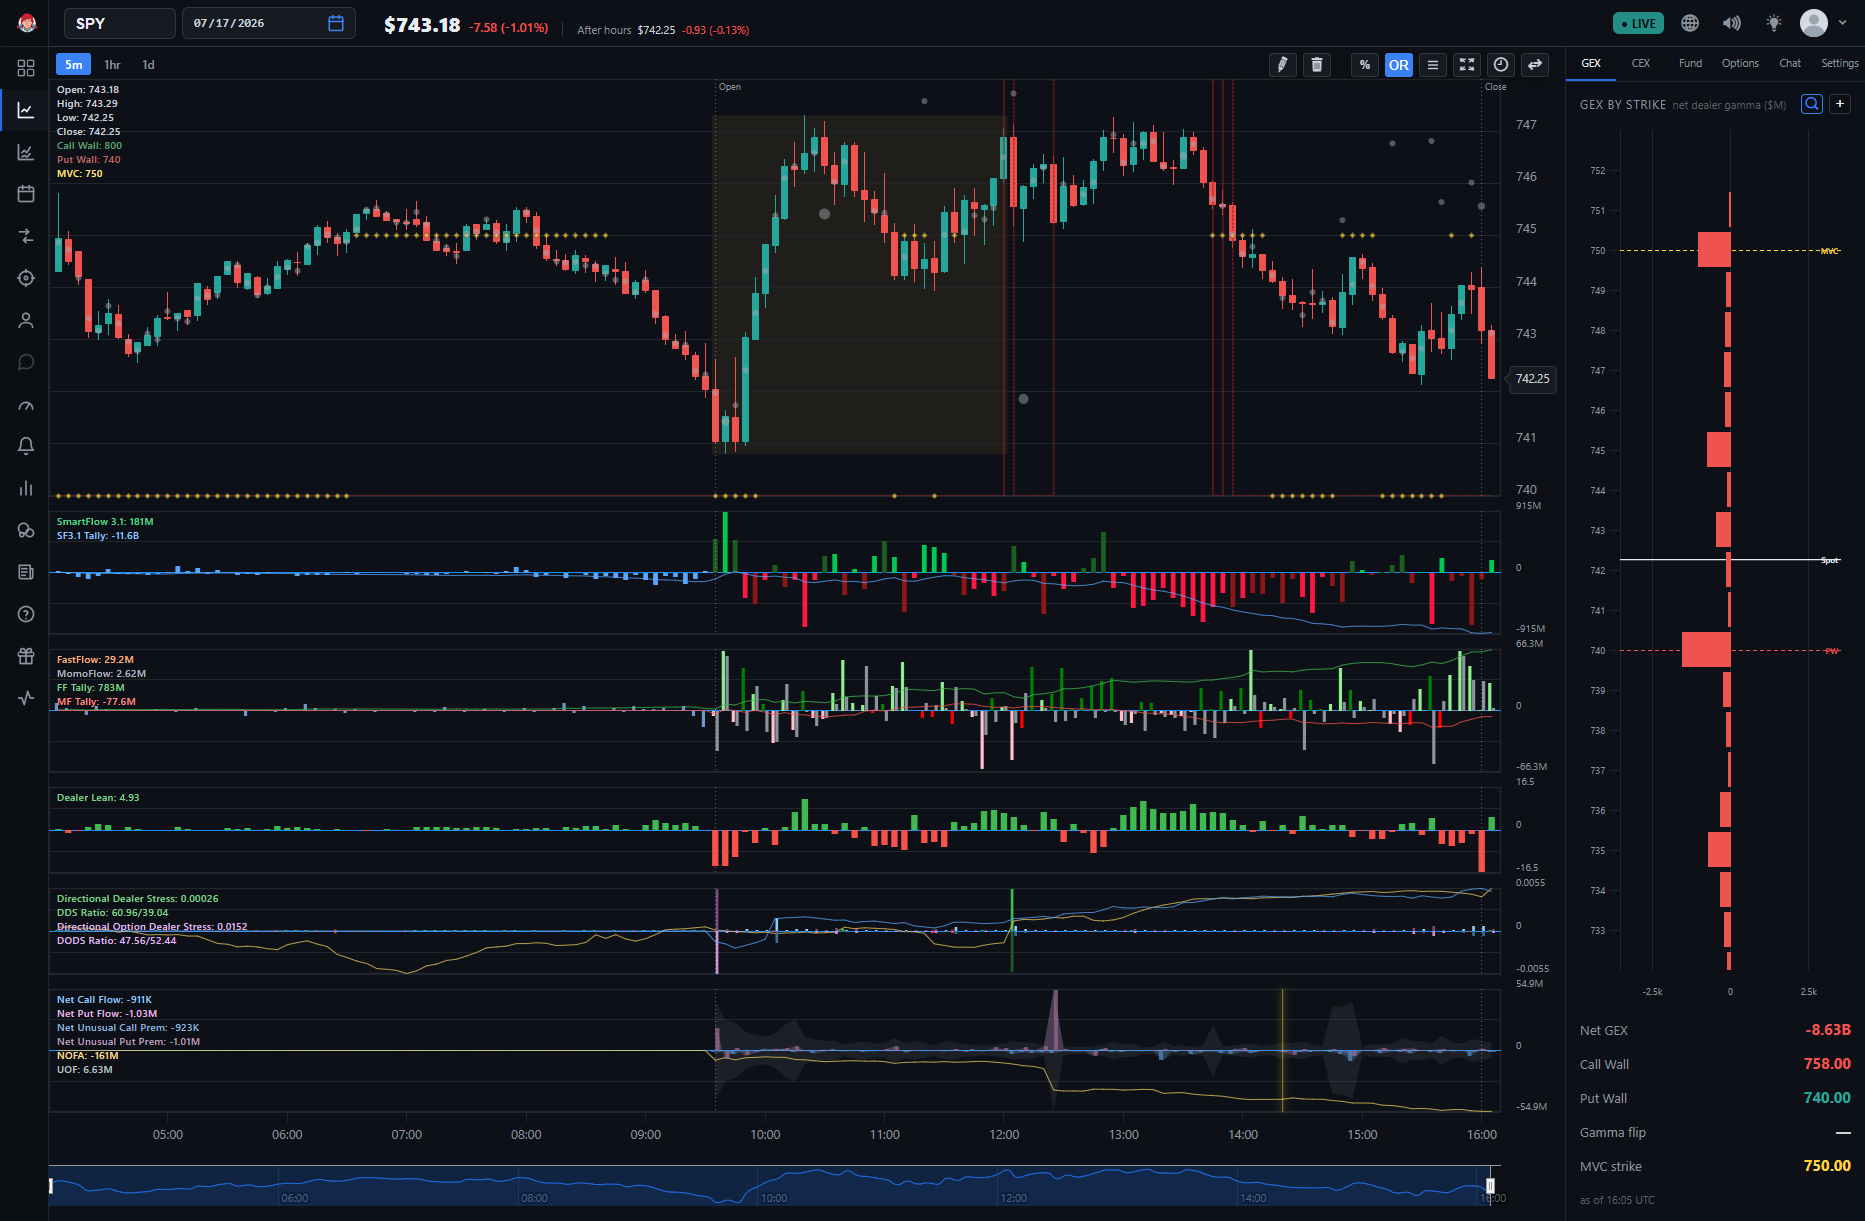
Click the GEX tab on the chart's right-hand side panel (alongside CEX, Fund, Options, Chat, and Settings) to open GEX by Strike — a vertical bar map of net dealer gamma exposure, in millions of dollars, at each strike around the current price. Green bars mean positive gamma at that strike, red means negative — so where the bars turn from green to red on the map is the by-strike picture of the Gamma Flip.
Below the map, a live readout lists the numbers behind it:
- Net GEX — the aggregate across the whole map, in dollars. This single figure tells you the market's overall regime: positive means dealers are net long gamma (dampening), negative means net short gamma (amplifying).
- Call Wall, Put Wall, MVC strike — the exact strike price of each level, updating live.
- Gamma flip — the strike price of the regime boundary; shows — when there's no clean crossing to mark.
The Net GEX pane in the chart's main indicator area (under the Skew / MM Skew / GEX checkbox) plots that same aggregate figure as a running series over the session, so you can watch the regime shift in real time instead of reading a single snapshot.
Gamma Flip
The Gamma Flip is the regime line: the price where dealers' net gamma exposure crosses zero. Per the mechanics above — above it, dealers hedge by selling into strength and buying into weakness (long-gamma, dampening); below it, their hedging trades in the same direction as the move (short-gamma, amplifying). Trading above the flip favors calm, mean-reverting conditions; losing the flip opens the door to faster, more volatile tape.
Call Wall and Put Wall
- Call Wall — the strike where call-side dealer gamma is most concentrated, the heaviest call-side hedging strike in the chain. It frequently acts as resistance.
- Put Wall — the strike where put-side dealer gamma is most concentrated. It frequently acts as support.
These are the walls the magnet and support/resistance behavior gather around.
Gamma Gravity
Gamma Gravity is the weighted center of the chain's gamma exposure — the price where current options positioning is concentrated overall. It's the clearest expression of the magnet: in a long-gamma regime, price tends to gravitate toward it.
MVC (Most Valuable Contract)
Traditional MVC marks the single strike with the highest gamma. BigShort’s MVC has some of that BigShort secret sauce to show you the strike carrying the most hedging significance, which seems to be more predictive than naive MVC. Its steadier companion, MVC Trend, ignores fleeting jumps and holds at the session's persistent battleground strike.
Pay extra attention to high gamma strikes and MVC, where other Support/Resistance price level indications have appeared in recent past, such as Dark Prints, NOF-driven pivots, etc.
The HP Levels (Call HP, Put HP, Zero HP, Gravity HP)
The HP ("hedging pressure") levels are slower-moving, legacy counterparts to the four levels above — stickier lines that filter out short-term noise:
- Call HP / Put HP — the legacy, slower counterparts to the Call Wall and Put Wall.
- Zero HP — the legacy version of the Gamma Flip boundary.
- Gravity HP — the legacy version of Gamma Gravity.
Use them when you want a level that changes less often than the live wall.
DTE Buckets (0 / 7 / All)
Each price level can be computed for a chosen expiry window — 0 DTE, 7 DTE, or All DTE. This matters because gamma is concentrated in the nearest expirations: 0-DTE levels are enormous but move fast and expire today; All-DTE levels are broader and steadier. Short-term traders lean on the 0-DTE view; swing traders watch the wider windows.
How to Use It
- Read the regime first. Is price above or below the Gamma Flip? That single fact tells you whether to expect dampening (mean-reversion) or amplification (momentum).
- Mark the walls. Treat the Call Wall and Put Wall as the day's likely ceiling and floor — and watch for acceleration if either breaks.
- Respect the magnet. In a long-gamma regime, expect price to drift toward Gamma Gravity / MVC, especially into the close on expiration days.
- Confirm with flow. Gamma levels are context. Combine them with real-time order flow — Net Option Flow, FastFlow and MomoFlow — before acting. Confluence is king.
- Charm: Time-Decay Hedging and the Drift Into the Close — the time dimension of dealer hedging
- Options Skew (Skew, MM Skew, Legacy Skew) — the volatility surface that shapes gamma
- Net Option Flow — the real-time flow to confirm level reactions
- Option Greeks: The 4 Factors to Measure Risk — Investopedia's primer on the greeks
-
🎥 The Trillion Dollar Equation — Veritasium on the math behind options pricing