Charm: Time-Decay Hedging and the Drift Into the Close
Gamma explains how dealers hedge when price moves. But dealers have to re-hedge even when price does nothing at all — simply because time passes. The greek that measures this is charm, and its hedging footprint is strongest exactly when many traders are paying least attention: into the closing bell, into Friday, and into monthly expiration. This guide explains charm and shows how to read BigShort's Charm Drift, Charm Flip, and CEX tools.
Charm Is Delta Decay
Charm is a second-order greek: the rate at which an option's delta changes as time passes (formally, the sensitivity of delta to time). It is sometimes called "delta decay."
Here's the intuition. As expiration approaches, options resolve toward certainty:
- An in-the-money option drifts toward a delta of 1 (it's going to behave like stock).
- An out-of-the-money option drifts toward a delta of 0 (it's going to expire worthless).
That migration happens on its own, with the clock, even on a flat tape. Because a dealer's hedge is sized to the delta of their book, a book that was neutral this morning is no longer neutral this afternoon — the deltas underneath it have decayed. To restore neutrality, the dealer must buy or sell the underlying. Charm is the map of that time-driven re-hedging.
A simplified way to think about this is to look at green bars as 0 dte calls and red bars as 0 dte puts. With green (calls), the delta decays as the day goes on, so dealers have to sell to stay hedged - that selling suppresses price, which is why green overhead acts as resistance and reads bearish. With red (puts), the delta rises back toward zero as the day goes on, so dealers have to buy — that buying props price up, which is why red underneath acts as support and reads bullish. The effect is strongest near expiration, and the biggest bars closest to spot generally have the most pull on price.
Why Charm Bites Into the Close and Into OPEX
Charm is small in the middle of a quiet week and large when time is running out:
- Into the close. A full trading day of decay accumulates, and dealers do much of their charm re-hedging in the final hour — one reason afternoons can drift in a persistent direction with no obvious news.
- Into the weekend. Two-plus calendar days of decay get priced in around Friday, concentrating charm flows late in the week.
- Into OPEX. Around monthly and quarterly expiration, huge open interest is decaying at once, and charm hedging can be a dominant flow.
- Near-dated options feel charm far more than far-dated ones, so 0-DTE and weekly positioning drive most of it.
Whether that flow pushes price up or down depends on which way the net decay leans — which is exactly what BigShort measures.

BigShort's Charm Tools
Find these under ⚙️ Settings → Greeks and in the CEX side panel.
Charm Drift
Charm Drift is the pane that quantifies the hedging pressure created purely by time decay — how much delta rolls off dealer books per day. Note the deliberate color convention, which matches the gamma story:
- Positive plots red, because decay is forcing dealers to sell.
- Negative plots green, because decay is forcing dealers to buy.
The larger the reading, the stronger the mechanical, clock-driven flow working under the surface.
Charm Drift Arrow
The Charm Drift Arrow distills that pane into a direction and a relative strength for the pressure dealers face into the close from time decay alone:
- Arrow up — dealers are mechanical buyers.
- Arrow down — dealers are mechanical sellers.
- No arrow — negligible charm pressure.
It's the quick, at-a-glance read for "which way is the close likely to lean, mechanically?"
Charm Flip
Just as the Gamma Flip marks where gamma hedging changes sign, the Charm Flip marks the price level where dealers' time-decay hedging pressure changes direction. On one side of it, charm-driven hedging leans one way; on the other, it reverses.
CEX (Charm Exposure)
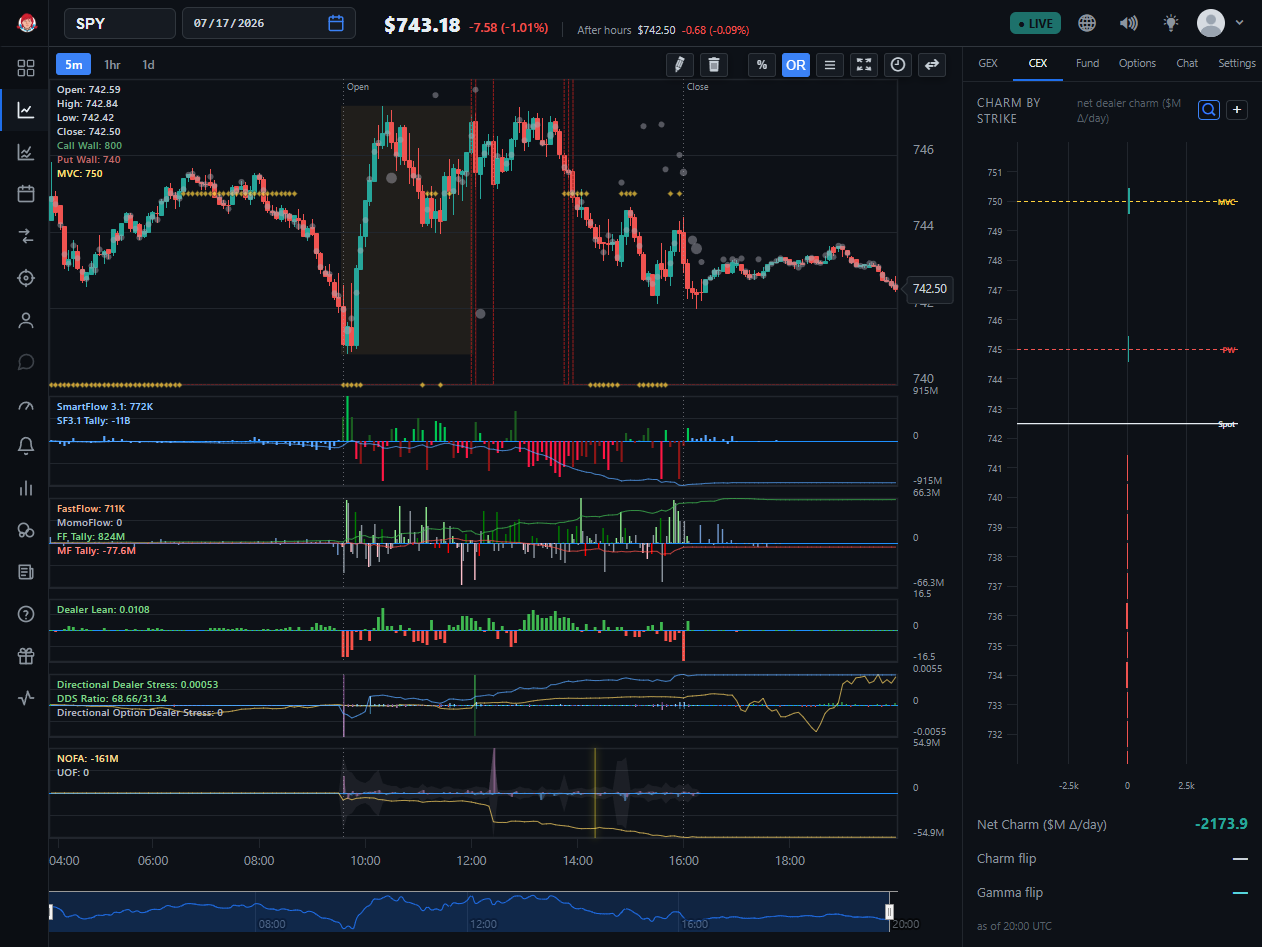
Click the CEX tab in the same side panel (next to GEX) to open Charm by Strike — the time-decay counterpart to the GEX map. It plots net dealer charm, in millions of dollars of delta-decay per day, at each strike, with Spot, MVC, and the nearest wall drawn as horizontal reference lines directly across the map, so you can see exactly how each strike's charm pressure sits relative to price.
- Green charm means delta decreases as time goes on - which is bearish because dealers have to sell.
- Red charm means delta increases as time goes on - which is bullish because dealers have to buy.
Other important CEX Notes:
- When you see green below spot and red above - you can think of it as “it could easily go up or down”
- When it’s green above and red below - you can think of it as being stuck around spot.
- But when you see nearly all green or all red - that can be a powerful directional sign.
Below the map, a live readout lists:
- Net Charm ($M Δ/day) — the aggregate across the whole map. Its sign tells you which way today's decay is pushing: positive means dealers are mechanical sellers, negative means mechanical buyers — matching Charm Drift's convention.
- Charm flip — the strike price where charm's direction changes; shows — when there's no clean crossing to mark.
- Gamma flip — shown alongside charm's own flip so you can see at a glance whether the price and time dimensions agree.
How Charm and Gamma Work Together
Gamma and charm are two dimensions of the same dealer-hedging picture:
- Gamma governs the reaction to price — the walls, the flip, the pinning covered in the Gamma guide.
- Charm governs the reaction to time — the mechanical drift that builds into the close and into expiration.
They frequently reinforce each other. A strong long-gamma pin into a Friday close, with charm leaning the same direction, is a textbook "quiet drift toward the magnet" setup. When they disagree, expect a messier tape.
How to Use It
- Check charm late in the day. Its influence is largest in the final hour and into Friday/OPEX — that's when the Charm Drift Arrow is most worth a glance.
- Read direction, then size. The sign tells you which way the mechanical flow leans; the magnitude tells you how much it matters relative to genuine order flow.
- Locate it with CEX. Use the CEX map to see which strikes are driving the pressure.
- Layer it on gamma and flow. Charm is context, not a trigger. Combine it with the gamma regime and real-time Net Option Flow before acting.
- Gamma, Dealer Hedging, and Why Price Reacts at Options Levels — the price dimension of dealer hedging
- Net Option Flow — the real-time flow charm hedging rides on top of
- Option Greeks: The 4 Factors to Measure Risk — Investopedia's primer on the greeks, charm included