Understanding Dark Pools and DarkFlow in BigShort
Dark pools are one of BigShort's signature data feeds, giving traders insight into off-exchange institutional activity that never touches the public tape. This article covers what dark pools are, where they live in the current app, and how to read them as part of your trading strategy.
Dark pool data is accessible both on the main chart (as part of the Price indicator) and via the standalone DarkFlow tab.
What Are Dark Pools?
Dark pools are private exchanges where large institutional trades take place outside of public markets. These transactions are kept anonymous so they don't move the market, and they often mark out real levels of support or resistance — trades below the current price tend to show up as support, while trades above it look more like resistance or overhead selling pressure.
Where to Find Dark Pools in BigShort
Dark pool prints are built into the Price indicator. When the Price indicator is enabled (it is by default), dark pools are displayed:
-
The main chart (app.bigshort.com/chart/SPY): dark pools shown for any ticker in real time
-
The UF Chart (app.bigshort.com/uf/UFSPY): dark pools shown for UF symbols in real time
🔊 Listen for the alert: the app plays a sound when a significant dark pool print lands, so you'll hear big off-exchange activity even when you're watching another pane. Use the speaker icon in the top bar to mute or unmute.
💡 Tip: Confluence is king! Dark pool signals are even stronger when they are supported by other traditional indicators and/or other signals in BigShort like price action, NOF, or SimSearch.
How Dark Pools Appear on Charts
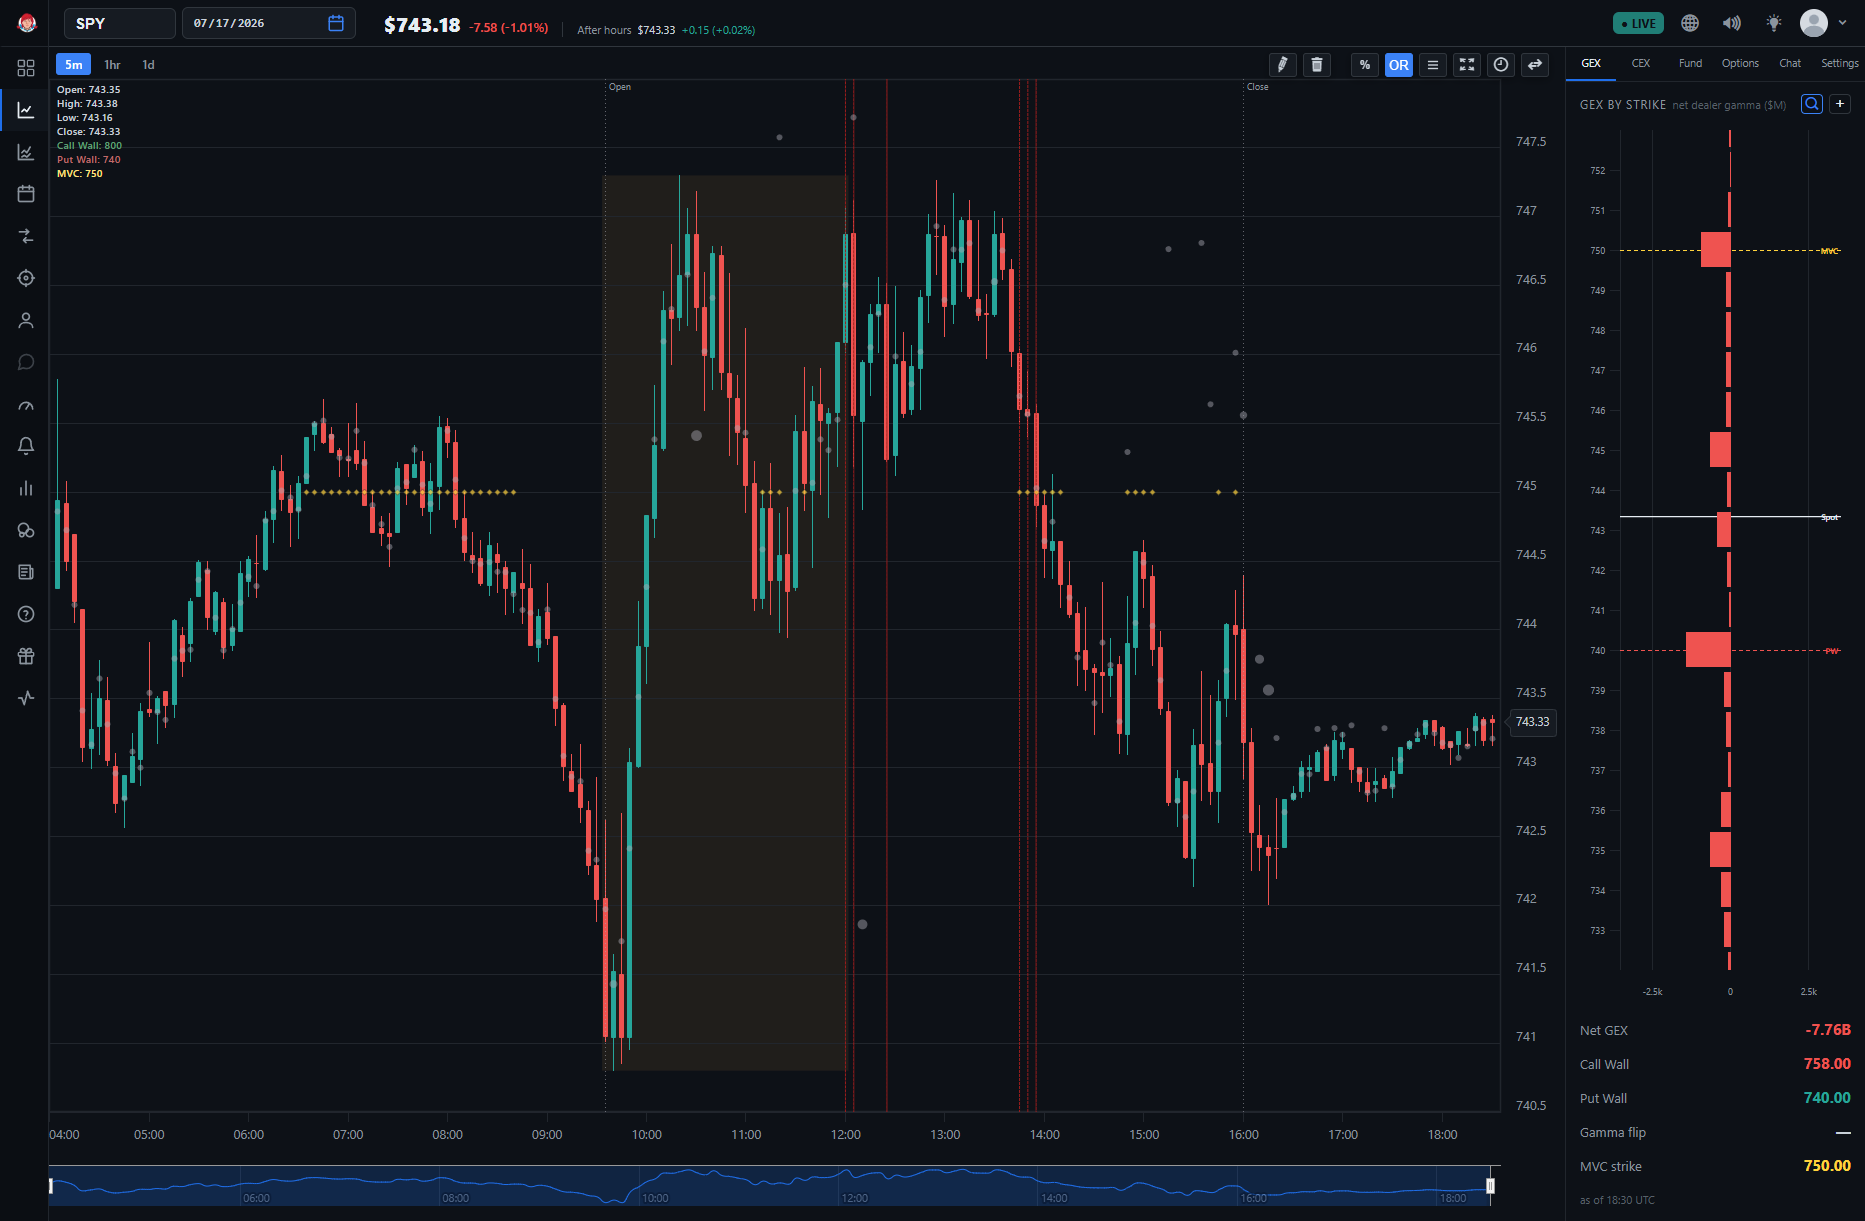
Dark Pool activity is visualized directly on your charts for any ticker :
-
Representation : Gray circles located around or within candlesticks.
-
The size of the circle reflects the volume of shares traded in a five-minute period.
-
Circles dynamically grow or shrink based on real-time activity, much like candlesticks.
-
Hover any print to see its exact price and volume in the tooltip.
-
-
Relative Position :
-
Below the candlestick : Indicates support and often upward price movement.
-
Above the candlestick : Indicates resistance and often downward price movement.
-
Within the candlestick: Generally not a signal either way.
-
Clusters and the "Weight" of Dark Pools
One single dark pool print is rarely a strong signal on its own — it's clusters of dark pools that tend to indicate real institutional activity. Size matters too: dark pools carry more weight when they're larger or further from the current price, but "large" only means something relative to that ticker's own history. A $20M dark pool might be huge for one name and barely noticeable for another, so it's worth reviewing historical days for the tickers you trade to get a feel for what size actually moves the needle.
Directionally, clusters below price action often force the price up, as if the buoyancy of institutional buying is lifting the market, while clusters above price action often force the price down, acting like a ceiling or weight pressing the market lower.
How to Interpret Dark Pools on Charts
When dark pools cluster below price action, it usually means large buyers are accumulating shares at a discount — a sign of confidence and bullish sentiment. For example, if dark pool activity clusters at $100 while the price sits at $105, the price may drop to $100 and then rebound.
When dark pools cluster above price action, it usually means large sellers are unloading shares at a premium — a sign of supply and bearish sentiment. For example, if dark pool activity clusters at $120 while the price sits at $115, the price may rise toward $120 but struggle to go higher, or eventually fall back.
When Dark Pools Help — and When They Mislead
They help most on liquid names where institutional flow is meaningful, and at price levels where prints cluster — those levels frequently behave as magnets, floors, or ceilings. They can mislead when read in isolation: a single print, on a thin ticker, or within a candle's price action, is noise more often than signal. Judge every print against that ticker's own history, and demand confluence with other Bigshort indicators, such as the BigFour — especially Net Option Flow and MomoFlow — before acting.
Like all BigShort indicators, Dark Pools can behave differently during power hour. Some users have noticed that sometimes dark pools can almost act as magnets during power hour, which is another reason we recommend new users to avoid trading power hour.