Similarity Search (SimSearch)
The Science Behind Similarity Search
Our approach is rooted in the understanding that market behavior often reflects human emotional patterns. We all wake up at the same time, eat lunch at the same time, get tired at the same time, etc. And just like our daily routines follow predictable rhythms, stock prices fluctuate in recognizable waves. This is why intraday studies are useful, and Similarity Search translates these emotional currents into actionable data.
To go deeper into the science behind SimSearch and improve your trading, read more here.
🚀 To the Moon: SimSearch doesn't exist anywhere else — it's built entirely in-house at BigShort.
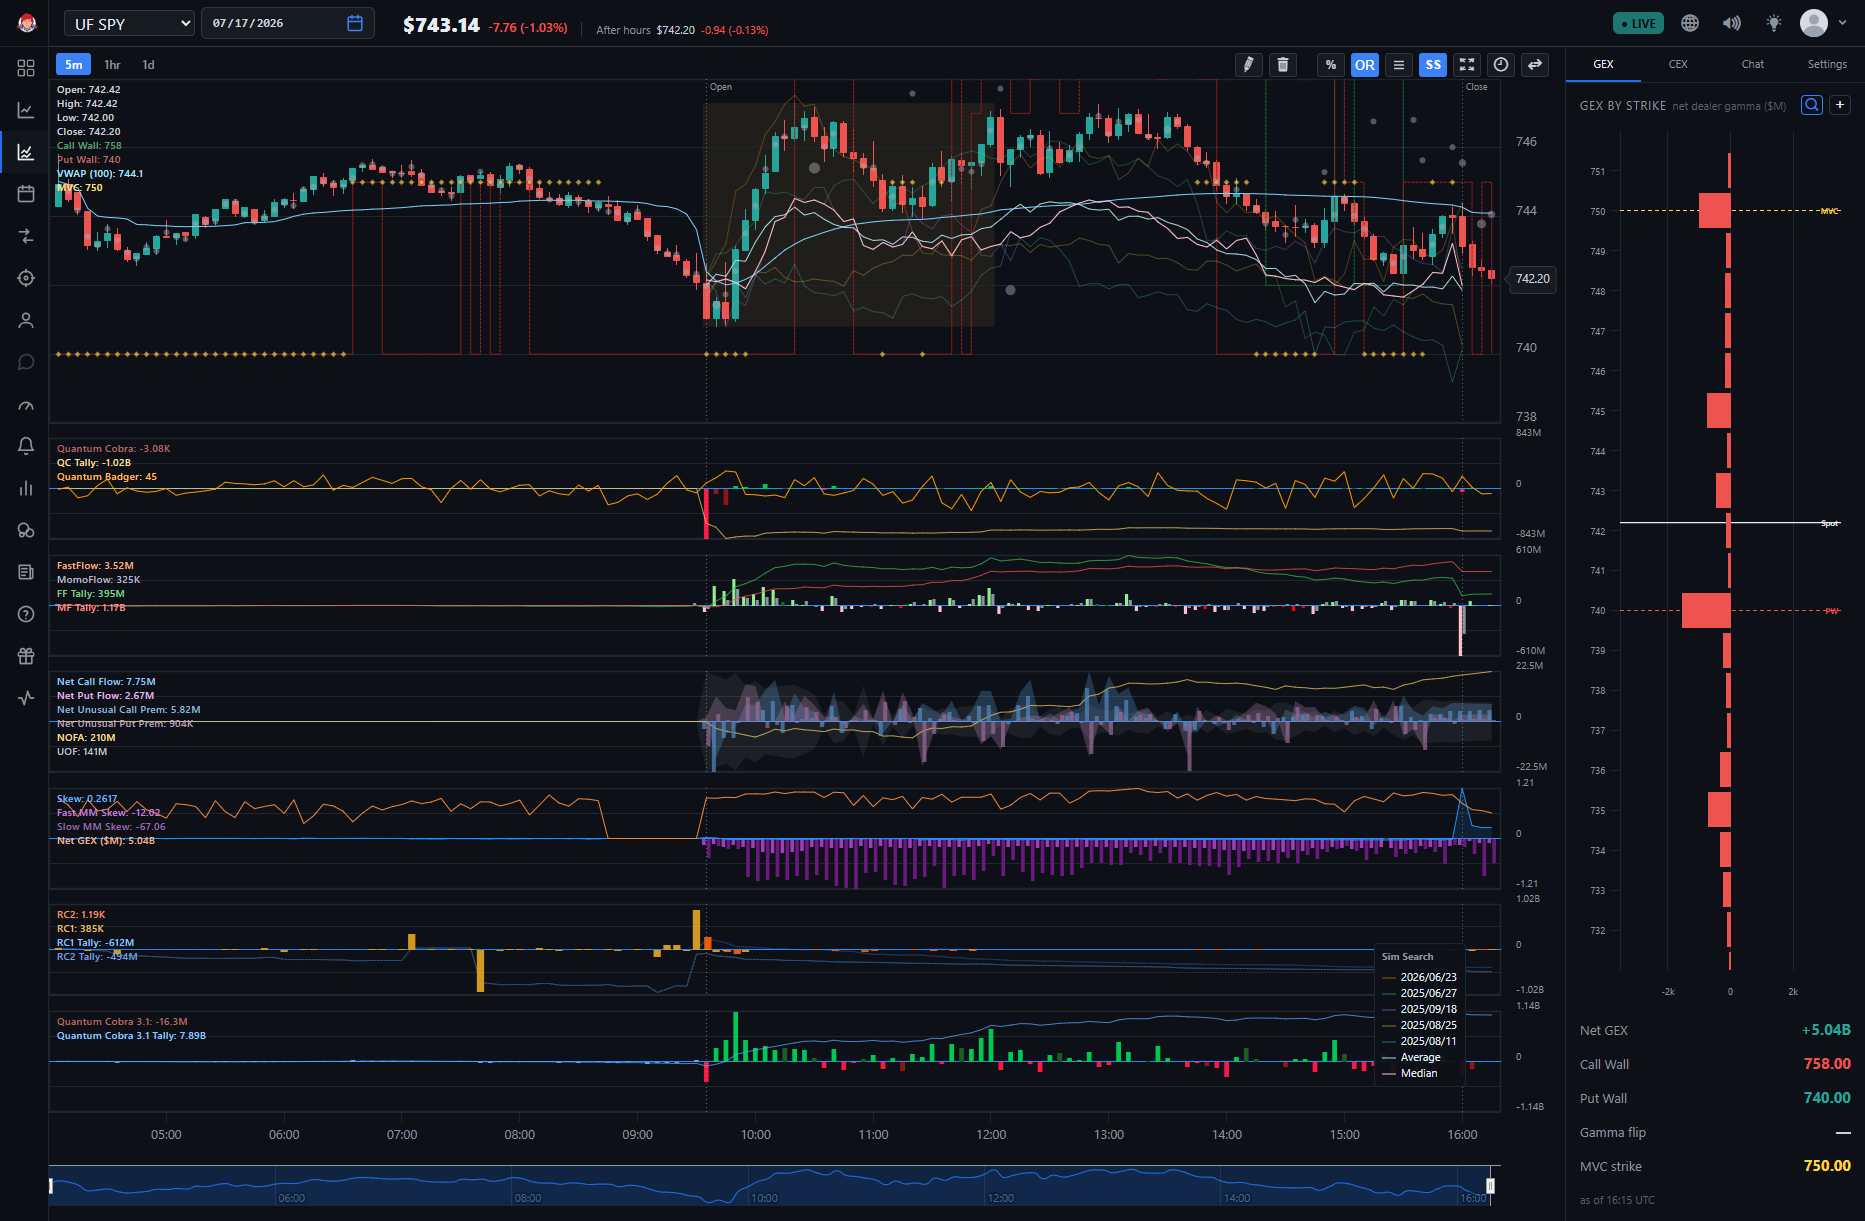
How to Access Similarity Search
In the BigShort app, open the UF Chart (app.bigshort.com/uf/UFSPY) and click the SS button in the chart toolbar — the app describes it as "Sim Search — overlay similar historical price patterns". At the bottom of the BigShort chart, you'll now see the 5 dates with the most similar price patterns to today's, as well as the SS median line, which is the median of all 5 days. Click on the dates to toggle them on and off.
How Similarity Search Works
SimSearch activates 30 minutes after the market opens, then updates every 2 seconds, continuously refining its results as more of the day's data comes in. Once live, it displays the 5 historical trading days that most closely match today's pattern, plus a median line averaging all five — and it covers the major index ETFs: SPY (S&P 500), QQQ (Nasdaq 100), and DIA (Dow Jones).
Reading the result comes down to agreement: when all 5 historical days point the same direction, that's a stronger predictive signal. When they diverge, treat it as a sign of higher uncertainty rather than a clean read.
The UF Chart Explained
The UF Chart aggregates indicator data from all the individual constituents of an ETF. For example, UFSPY combines FastFlow, Manipulation, and Net Option Flow data for every ticker in the S&P 500 into a single chart.
Using SimSearch Well
Pair Similarity Search with Net Option Flow to fine-tune your entries and exits — SimSearch tells you what similar days tended to do, NOF tells you whether today's options activity actually agrees. Drawing on almost a decade of historical data, it's built specifically to answer "what happened last time this looked like today," rather than just describing the present.
⚠️ Don't use SimSearch for price targets, use it for behavior over time. Don't rely on it for price levels, but rely for inflection times.