SmartFlow 3 and SmartFlow 3.1: BigShort's Flagship Elite Flow Signal
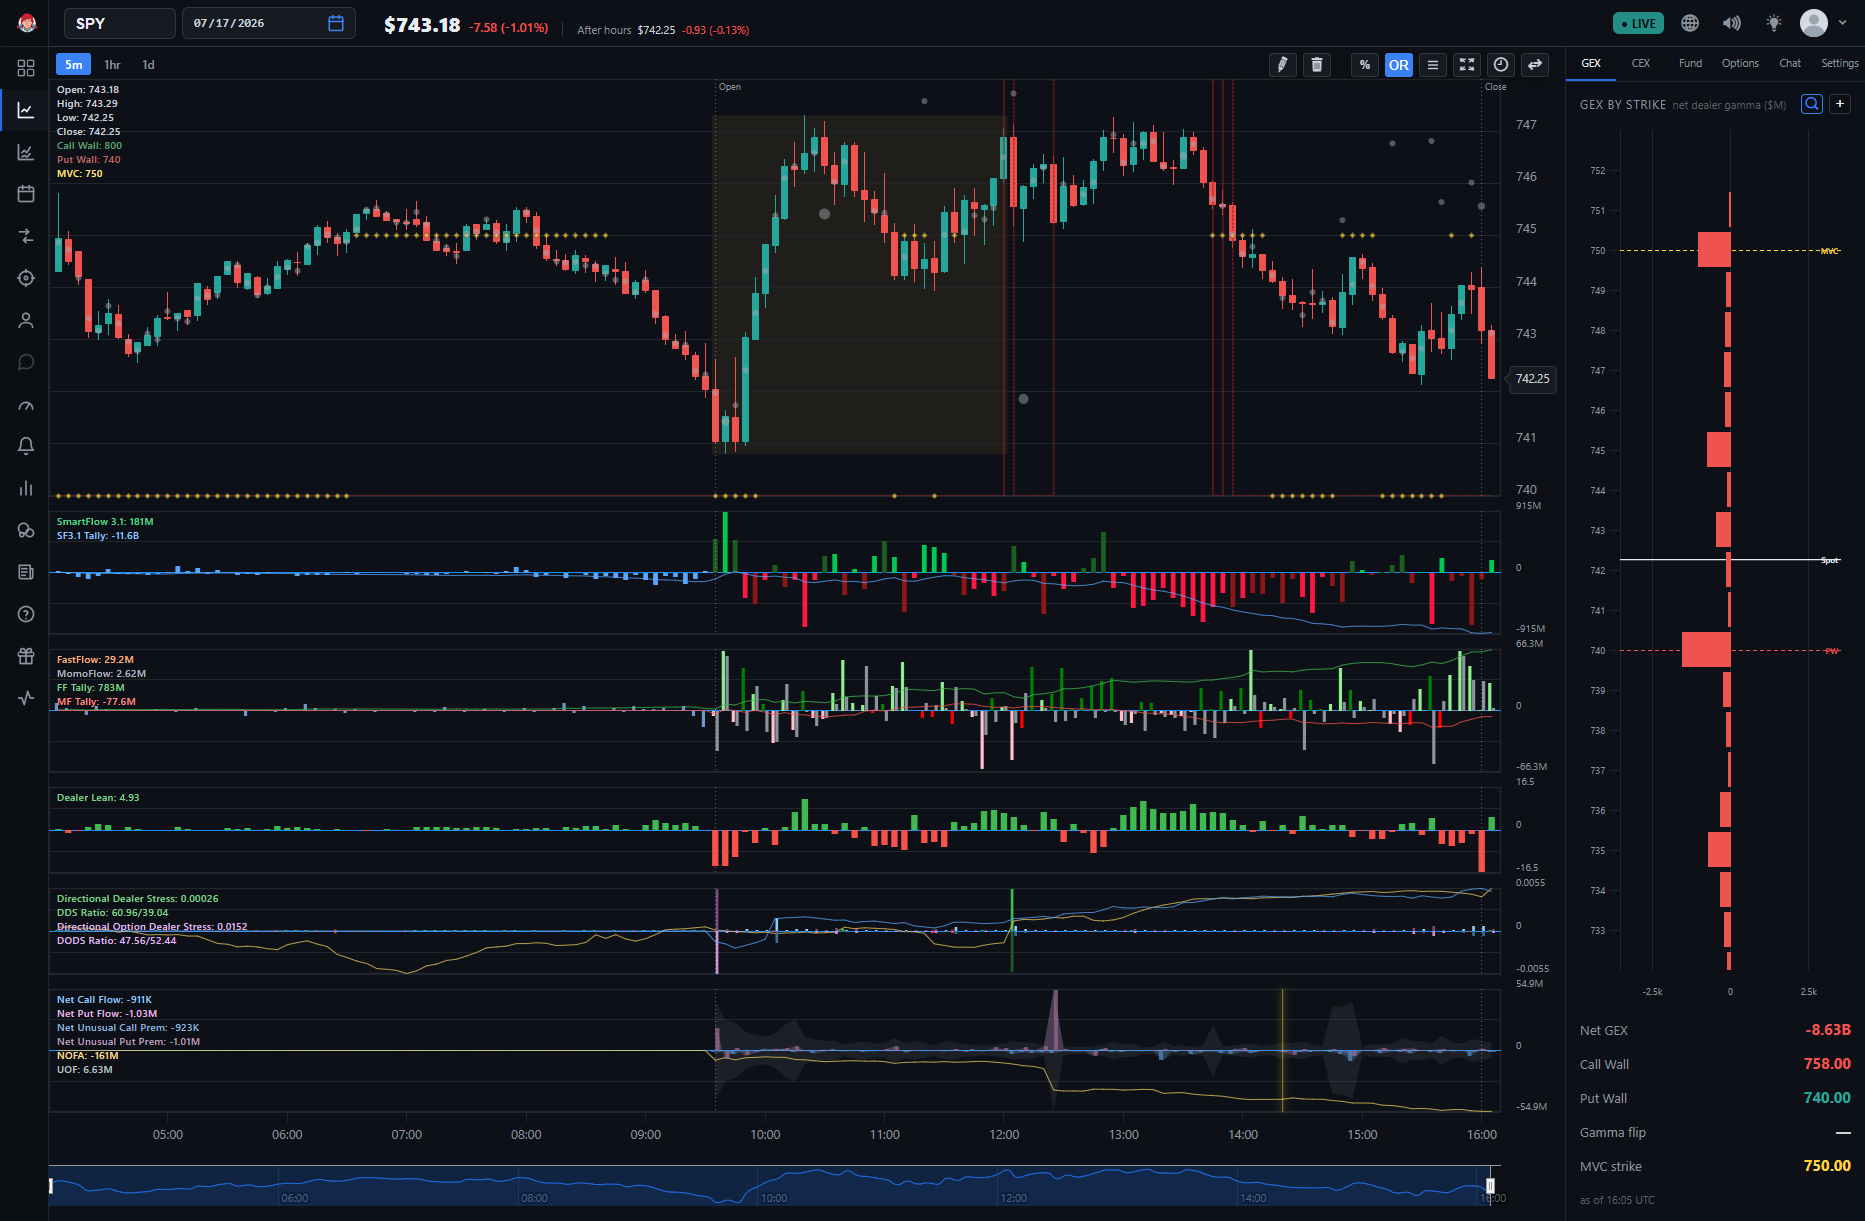
Every flow pane on a BigShort chart is chasing the same question: who is actually winning beneath the price bars — the buyers or the sellers? SmartFlow is BigShort's flagship answer. This guide covers the two current generations of the signal, SmartFlow 3 (SF3) and SmartFlow 3.1 (SF3.1) — what each one draws and how to read them.
Both are BigShort Elite indicators — they require the Elite subscription tier. If you're logged out, the app still shows the indicator names with a Subscribe to unlock option.
📝 A note on names: BigShort's FastFlow was formerly called SmartFlow. SmartFlow 3 and SmartFlow 3.1 are separate, different indicators — this article covers them, not FastFlow.
SmartFlow 3 (SF3)
Flagship Elite flow signal: a real-time measure of net buying vs. selling pressure building beneath the tape.
It draws as a bar-plus-line pane, and the color rules come straight from the same definition — "Green bars = net buy-side pressure, red = net sell-side; the gold line is the session’s running total":
- Green bars = net buy-side pressure, while MM'ss are distributing. (Fade-able when we see a green spike after a move)
- Red bars = net sell-side pressure, while MM's are accumulating. (A red spike after a move can often indicate a bounce is imminent)
- Gold line = the session's running total.
Bar by bar, SF3 tells you which side is applying more pressure right now. The gold line accumulates those bars into a single session-level read, so you can see at a glance how the day's pressure has been adding up.
As always, never blindly follow a single indicator. Read indicators in context with other. Look for confluent with PA and other BigShort indicators.
💡 Dark vs. light bars: SF3 also draws in two shades. A dark bar (dark green or dark red) means SF3 is not aligned with MomoFlow; a light bar (light green or light red) means it is aligned. FastFlow plays no part in this — it's purely an SF3-vs-MomoFlow read. (Quantum Cobra on the UF Chart shares this same dual-shade convention.)
🔎 Looking closer: The key phrase is building beneath the tape. SmartFlow is a pressure read, not a price read — it measures the net buying and selling pressure underneath the price bars, which is exactly why it earns a pane of its own instead of being read off the candles.
SmartFlow 3.1 (SF3.1)
The next generation of SmartFlow: a faster, more responsive measure of net buying vs. selling pressure beneath the tape. Its running total is the blue line — in the chart's floating readout that series appears as SmartFlow 3.1 Tally.
Same underlying question, faster read. Both generations remain available as separate checkboxes — enabling 3.1 doesn't retire 3 — so you can draw either one, or both, and compare them on your own chart.
💡 Tip: Across BigShort's panes, a Tally is a running session total of its parent series — a view of the same indicator, not a separate one. The blue SF3.1 line carries the label explicitly (SmartFlow 3.1 Tally in the readout); the gold SF3 line plays the same session-total role, though the app doesn't label it a Tally.
How to Use Them
- Read the bars for the immediate balance. Green = net buy-side pressure, red = net sell-side. That's the here-and-now read.
- Read the running total for the session. The gold (SF3) or blue (SF3.1) line rolls the bars up into the session-level picture.
- Pick your generation. SF3 is the flagship signal; SF3.1 asks the same question with a faster, more responsive read. Nothing stops you from watching both.
- Confirm with the rest of the stack. SmartFlow is context and confirmation, not a standalone entry trigger. Pair it with FastFlow and MomoFlow and Net Option Flow — confluence is king.
- Watch for reversal setups. A flip — SF3 or SF3.1 turning from red to green, or from green to red — can be read as capitlation; an inflection point and the flip itself carries more weight than whichever color happens to be showing. SF3 tends to run in long directional streaks, which is part of why the break stands out: a sustained run in one color can reflect market makers and passive liquidity building or unwinding a position beneath the tape rather than straightforward buying or selling, with the flip marking the point where that pressure lets go.
- Watch for exhaustion. An outsized SF3 or SF3.1 bar that shows up after a sustained directional move is read as exhaustion — the move running out of steam rather than continuing.
Where to Find Them
Both live under ⚙️ Settings → BigShort Elite Indicators on the main chart (app.bigshort.com/chart/SPY), alongside M2 RC1 + RC2. They are main-chart indicators: the UF Chart has its own Elite set, built around the Quantum Cobra family, and SF3/SF3.1 do not appear there.
An Elite subscription is required to enable them; logged-out users see the names with a Subscribe to unlock option.
- FastFlow and MomoFlow — the standard-tier flow pair (FastFlow was formerly called SmartFlow)
- Quantum Cobra and Quantum Cobra 3.1 — the UF Chart's Elite indicator family
- Ultraflow (UF) Chart — the index-wide chart with its own Elite set
- Net Option Flow — real-time options sentiment to confirm what the flow is telling you