From Signal to Strategy: Trade Ideas with BigShort
In this section, we'll walk through examples of how BigShort indicators work. We've designed it to be as easy and comprehensive as possible, so new users can follow along and start backtesting on their own. The goal is to help you build confidence in your trading, step by step.
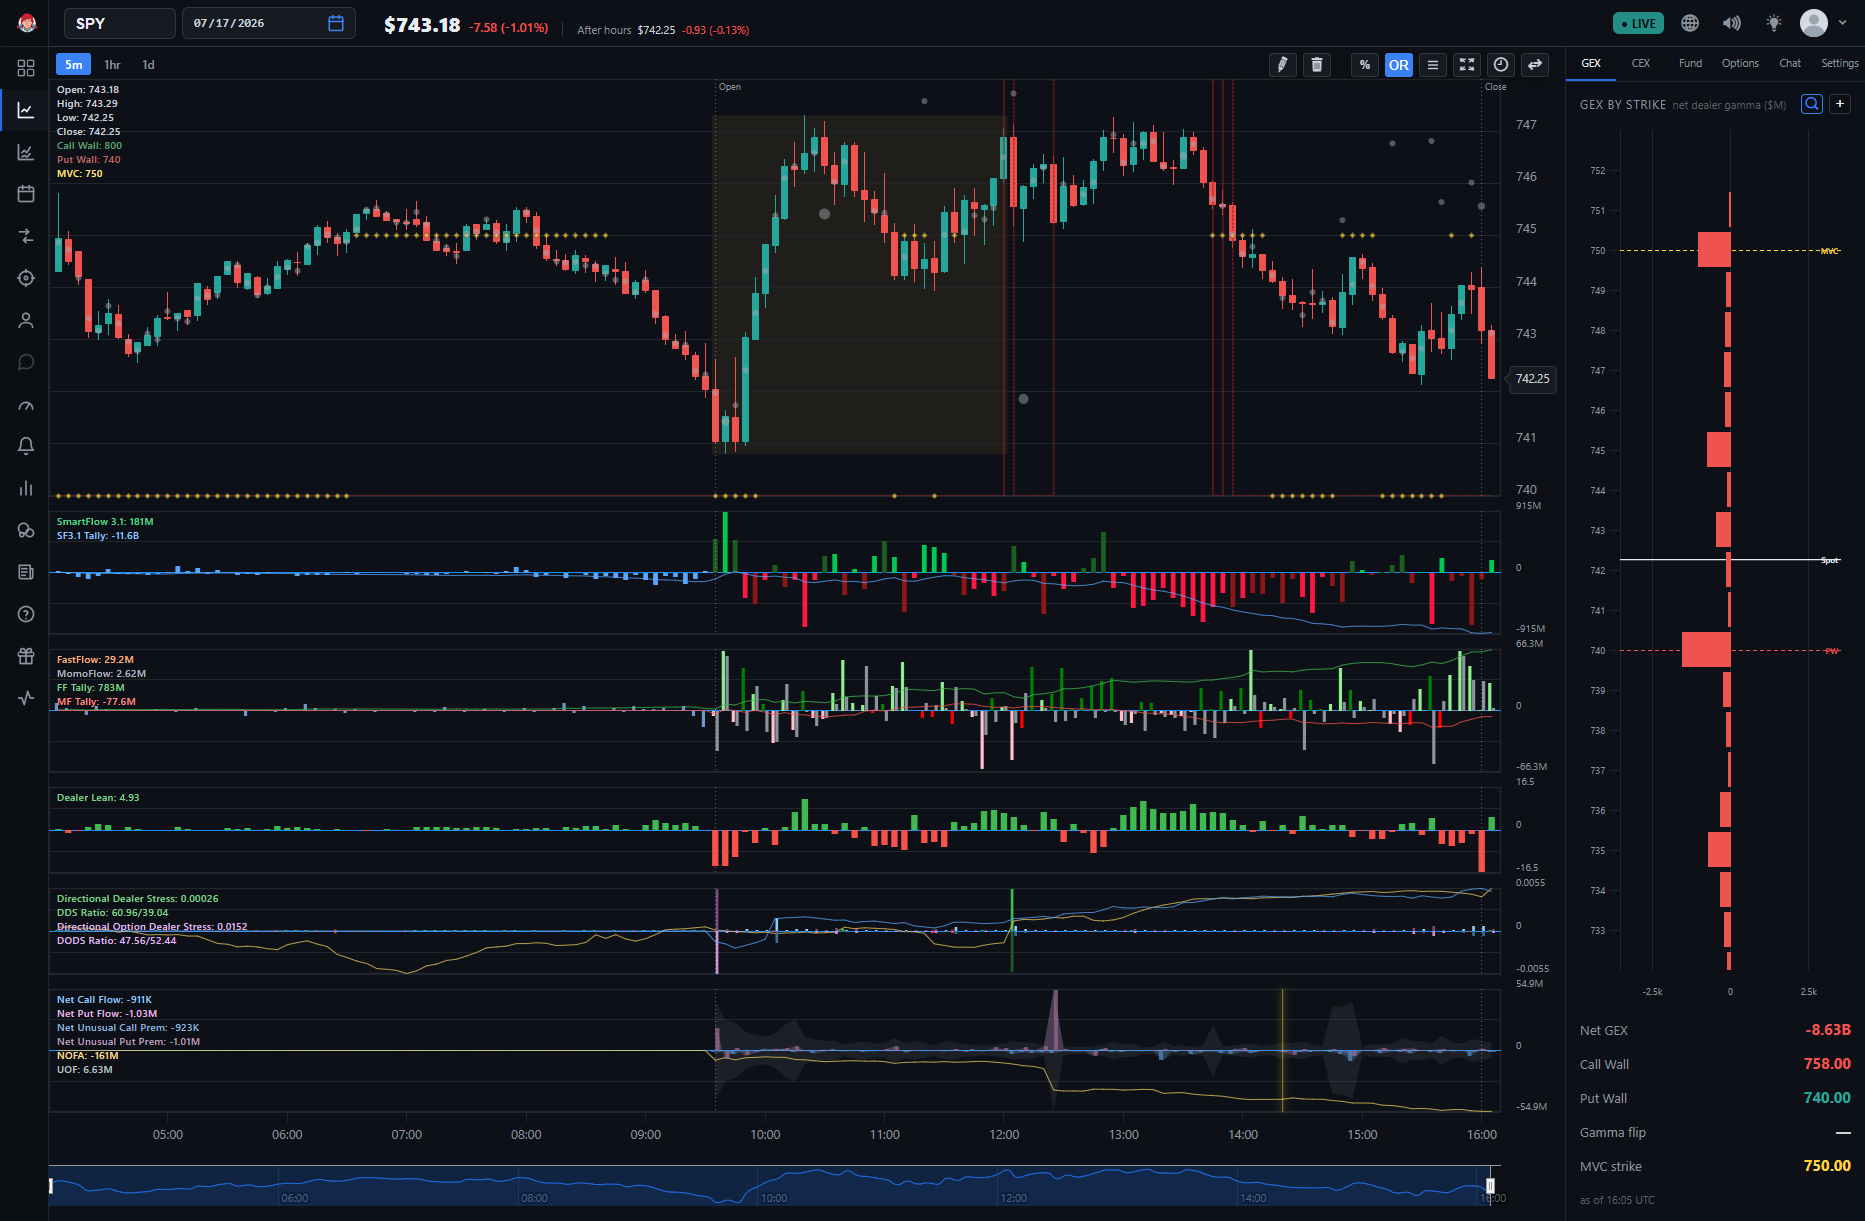
GEX Signals
Turn GEX on via ⚙️ Settings → Greeks.
GEX Selling Pressure
The red line is moving upward. This is a bearish signal, indicating selling pressure. As expected, the price begins to move downward, confirming the bearish setup.
GEX Bullish
The red line is moving downward. This is a bullish signal, indicating buying pressure. As expected, the price begins to move upward, confirming the bullish setup.
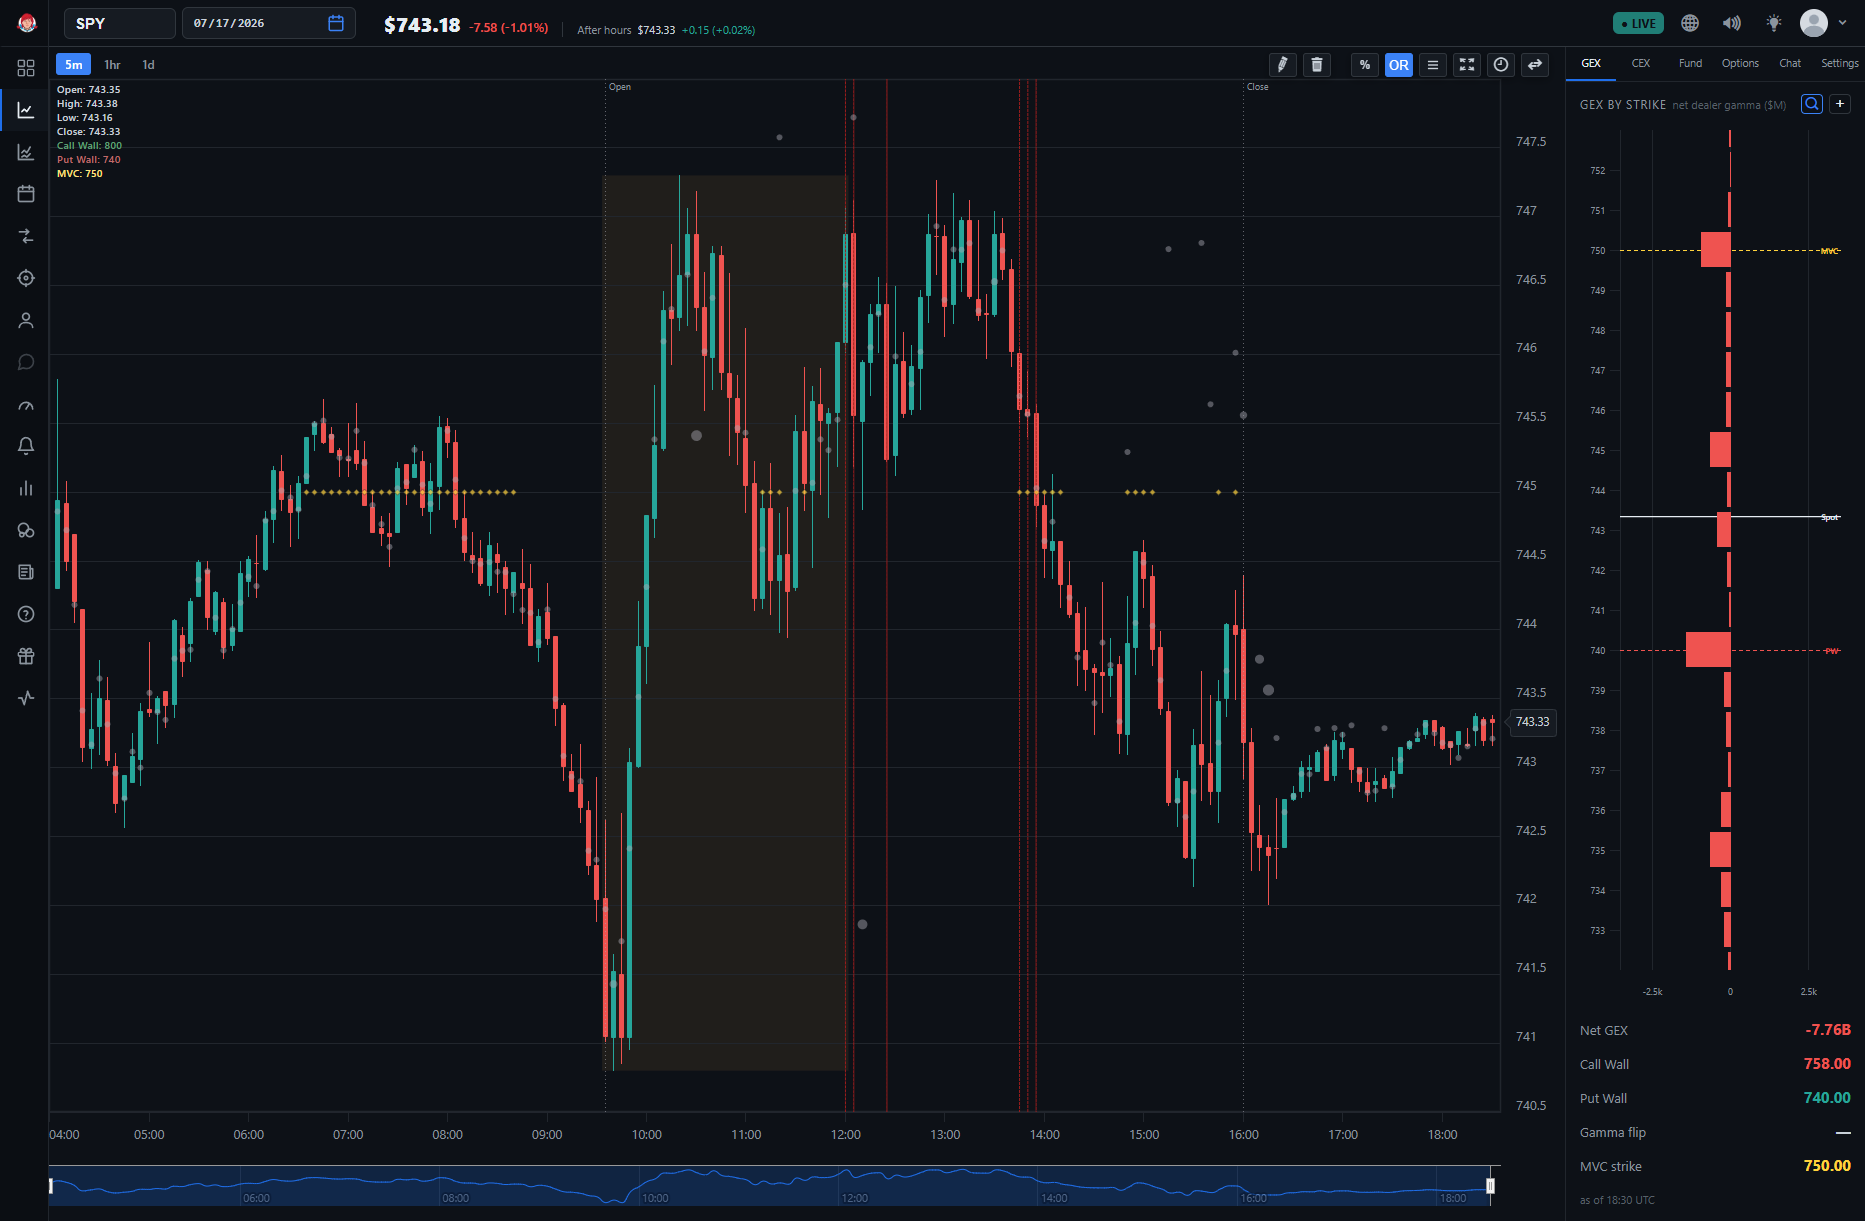
GEX Multiple Confirmations
The red line is moving upward, and the green line is moving downward. Both are bearish signals, indicating selling pressure. As expected, the price begins to move downward, confirming the bearish setup.
Note: This kind of setup has high conviction and was described by our founder as "free money." You can refer to the GEX section for more details.
Dark Pool Signals
Dark pool prints show up as grey dots on the Price pane (part of the Price indicator, and also available via the standalone DarkFlow tab). The dark pool signal appears above the candlestick, indicating resistance, a bearish setup. As expected, the price moves down.
🕒 Note: We don't take this trade because it occurs during power hour.
Net Option Flow (NOF) Signals
MomoFlow Bearish Shadow Bars + NOF Signal
MomoFlow shadow bars up , and the NOF purple line is pointing upward. Both are bearish signals. As expected, the price begins to move downward, confirming the bearish setup.
Flow Signals
Turn MomoFlow (Momo) and FastFlow (FF) on via ⚙️ Settings → Core Flow.
MomoFlow Up
The MomoFlow indicator is pointing upward, signaling bearish. As anticipated, the price begins to move downward, confirming the bearish setup in the following examples:
MomoFlow Up Example 1
SPY at 09:50 10/23/2025, we see MomoFlow peak up, and price goes down in the following bars.
The screenshots below were captured in BigShort's v1 interface; the setup and mechanics they show are unchanged in today's app.
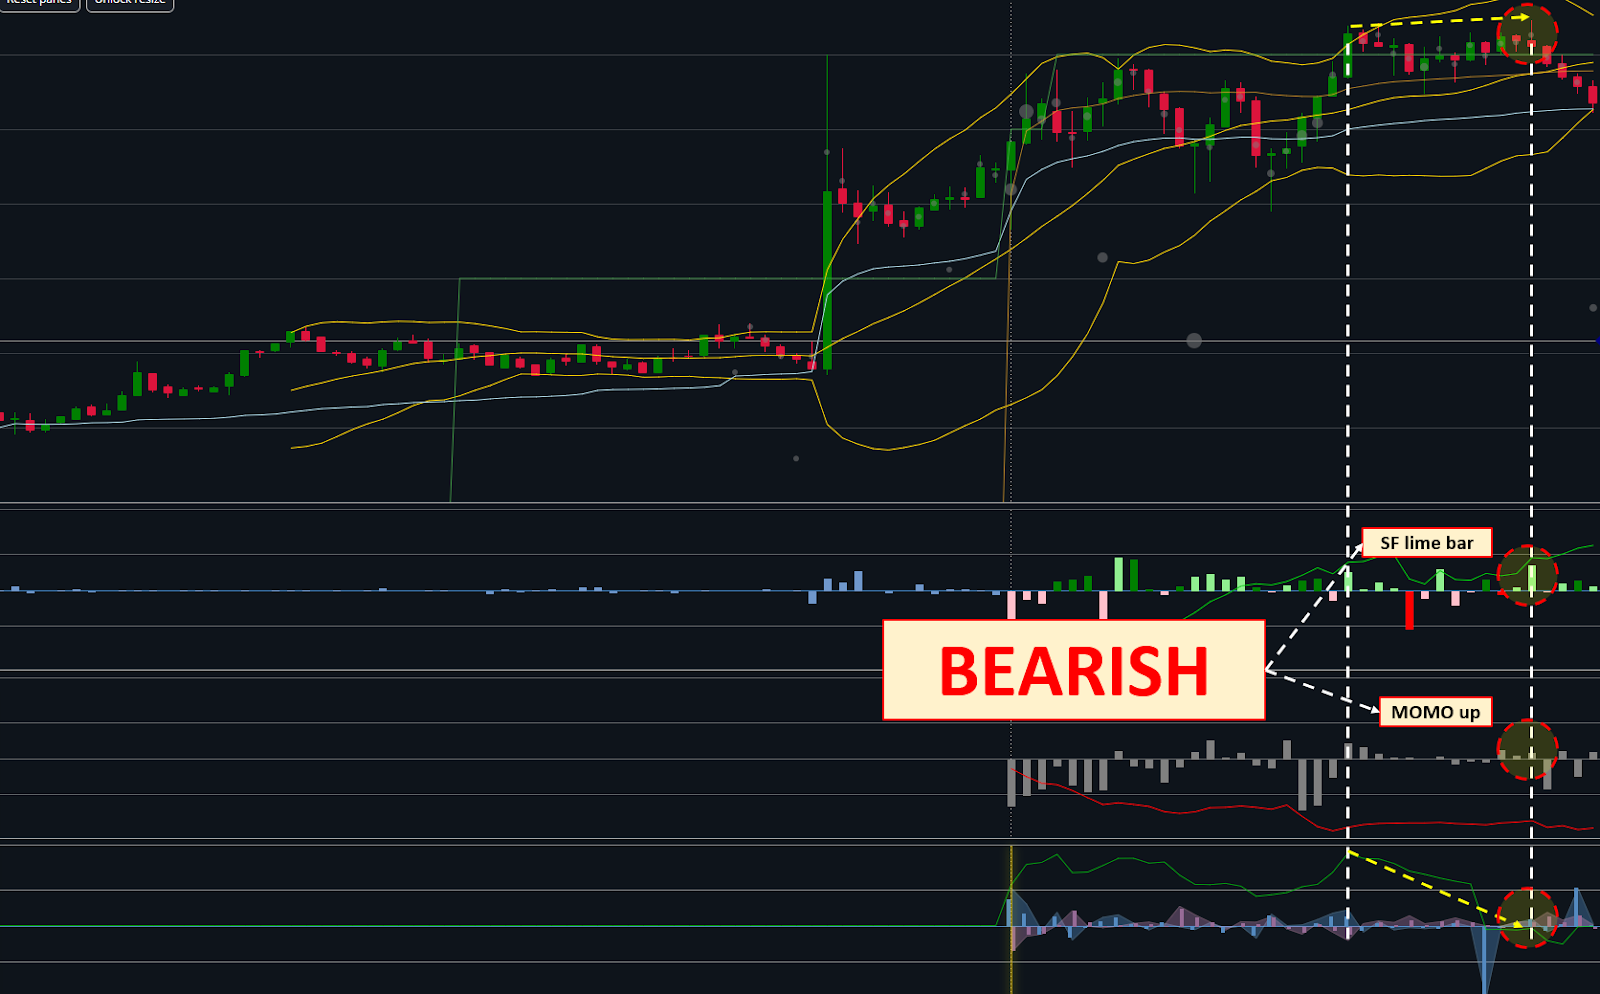
MomoFlow Up with FF confirmation Example 2
SPY at 11:15-11:30 on 10/24/2025, we see MomoFlow increasing with a peak at 12:25 along with confirmation from FF; price immediately goes down.
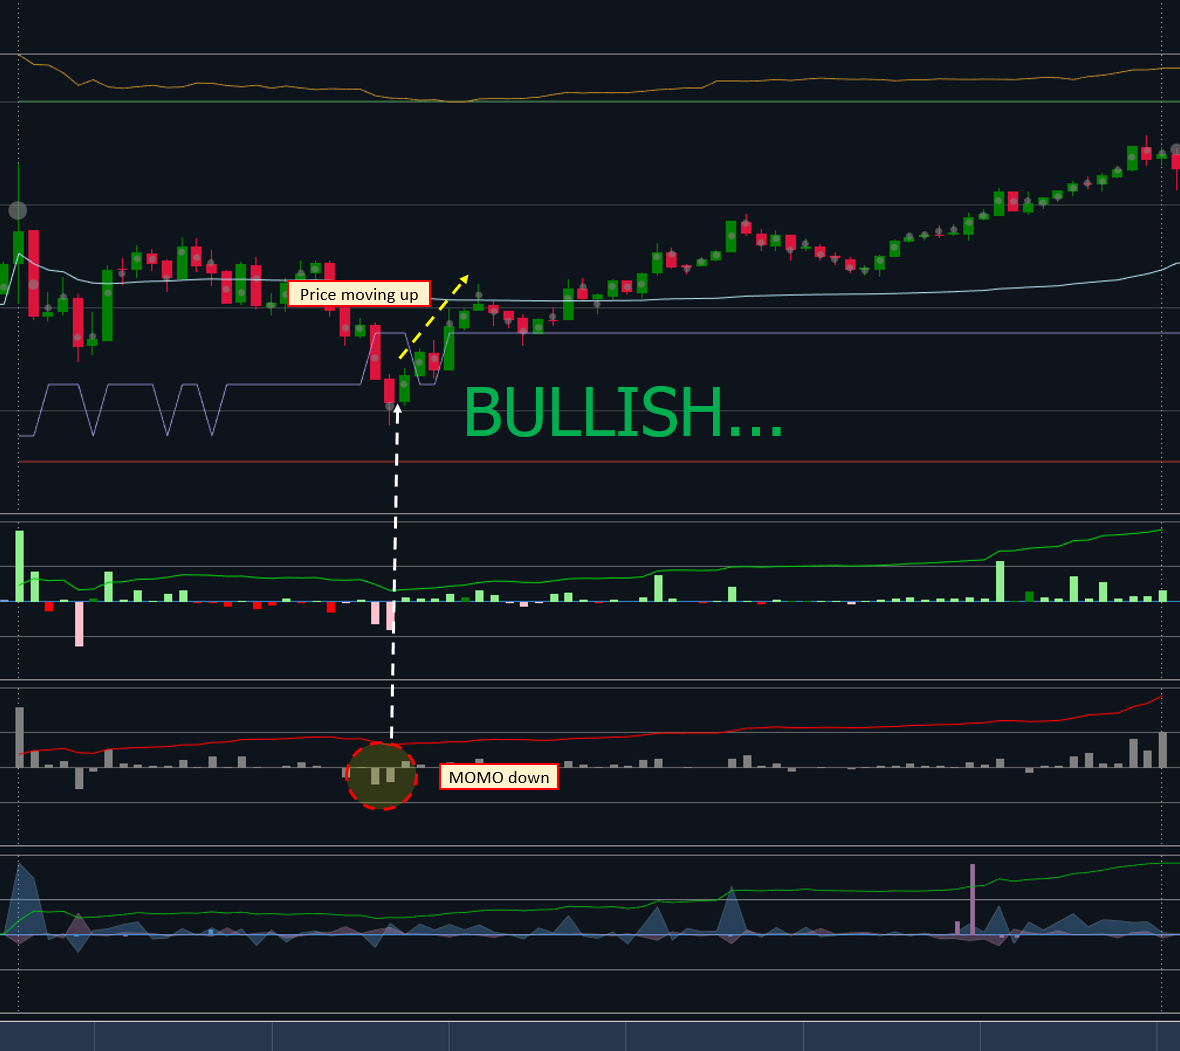
MomoFlow Down
The MomoFlow indicator is pointing down, signaling bullishness. As anticipated, the price begins to move upward, confirming the bullish setup in the following examples:
MomoFlow Down Example
The MomoFlow indicator is downward, signaling bullishness. As anticipated, the price begins to move upward, confirming the bullish setup.
You're All Set!
Congrats on making it through the BigShort onboarding guide. Whether you're here to explore trading patterns, optimize your workflow, or just get comfortable with the platform, you've taken a solid first step.
If you're ready to take things further, consider upgrading to Elite Membership. It's a great way to enhance your experience and unlock more of what BigShort has to offer.