Main Features - Tabs
This section outlines the core areas of the application. As there are several features and concepts that appear across multiple pages, we'll dive deeper into those Key Concepts and Indicators later. First, it's important for you to understand the lay of the land, what makes each tab unique, and how to leverage them together in a streamlined trading workflow.
Don't worry about whether all these make 100% sense right now. After you've studied all Indicators and Concepts, you can circle back here.
Dashboard
The Dashboard is your morning routine — a set of scanners that surface the most unusual activity across the market, flagging imminent moves and continuations. Every screener (Positive/Negative NOFA (Martian), Positive/Negative Momo Flow, Expensive/Cheapest Options, and the Short Exempt panels) is built on Key Concepts & Indicators found elsewhere in BigShort, so see the applicable indicator for full detail.
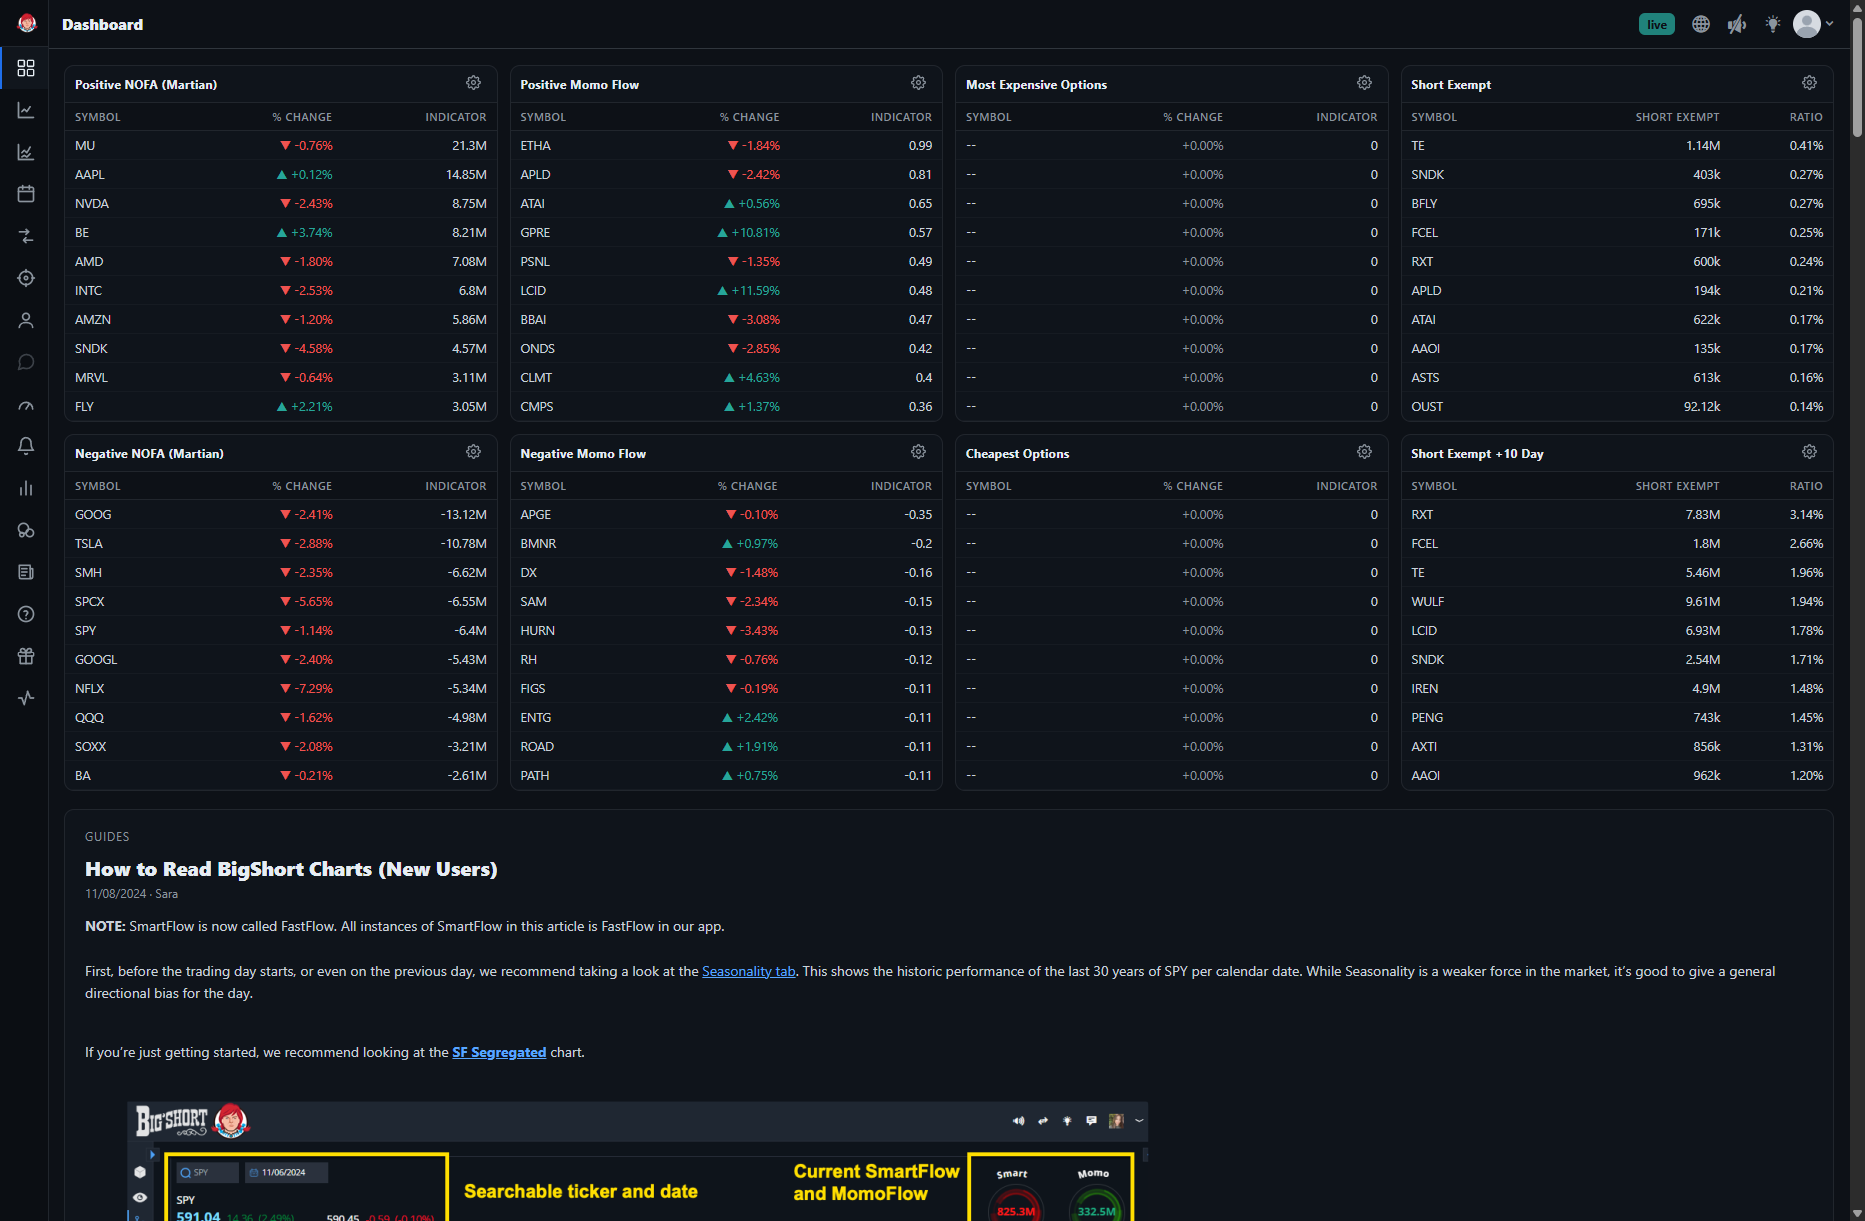
Full guide: Dashboard & Top 10s
The Chart
BigShort v2 has one chart, at app.bigshort.com/chart/SPY: everything that used to be split across separate "FF Segregated" and "FastFlow" screens now lives here as indicators you toggle on and off through ⚙️ Settings. Its Core Flow group — FastFlow (previously SmartFlow), MomoFlow, Manipulation, Dealer Lean, Directional Dealer Stress/DODS, and Panican Pelican/Orangutan — processes, segments, and aggregates millions of data points each second to tell the story behind the volume bars: whether Smart Money is buying or selling, whether the MOMO crowd has run out of steam, and how Market Makers will rebalance after a sharp move.
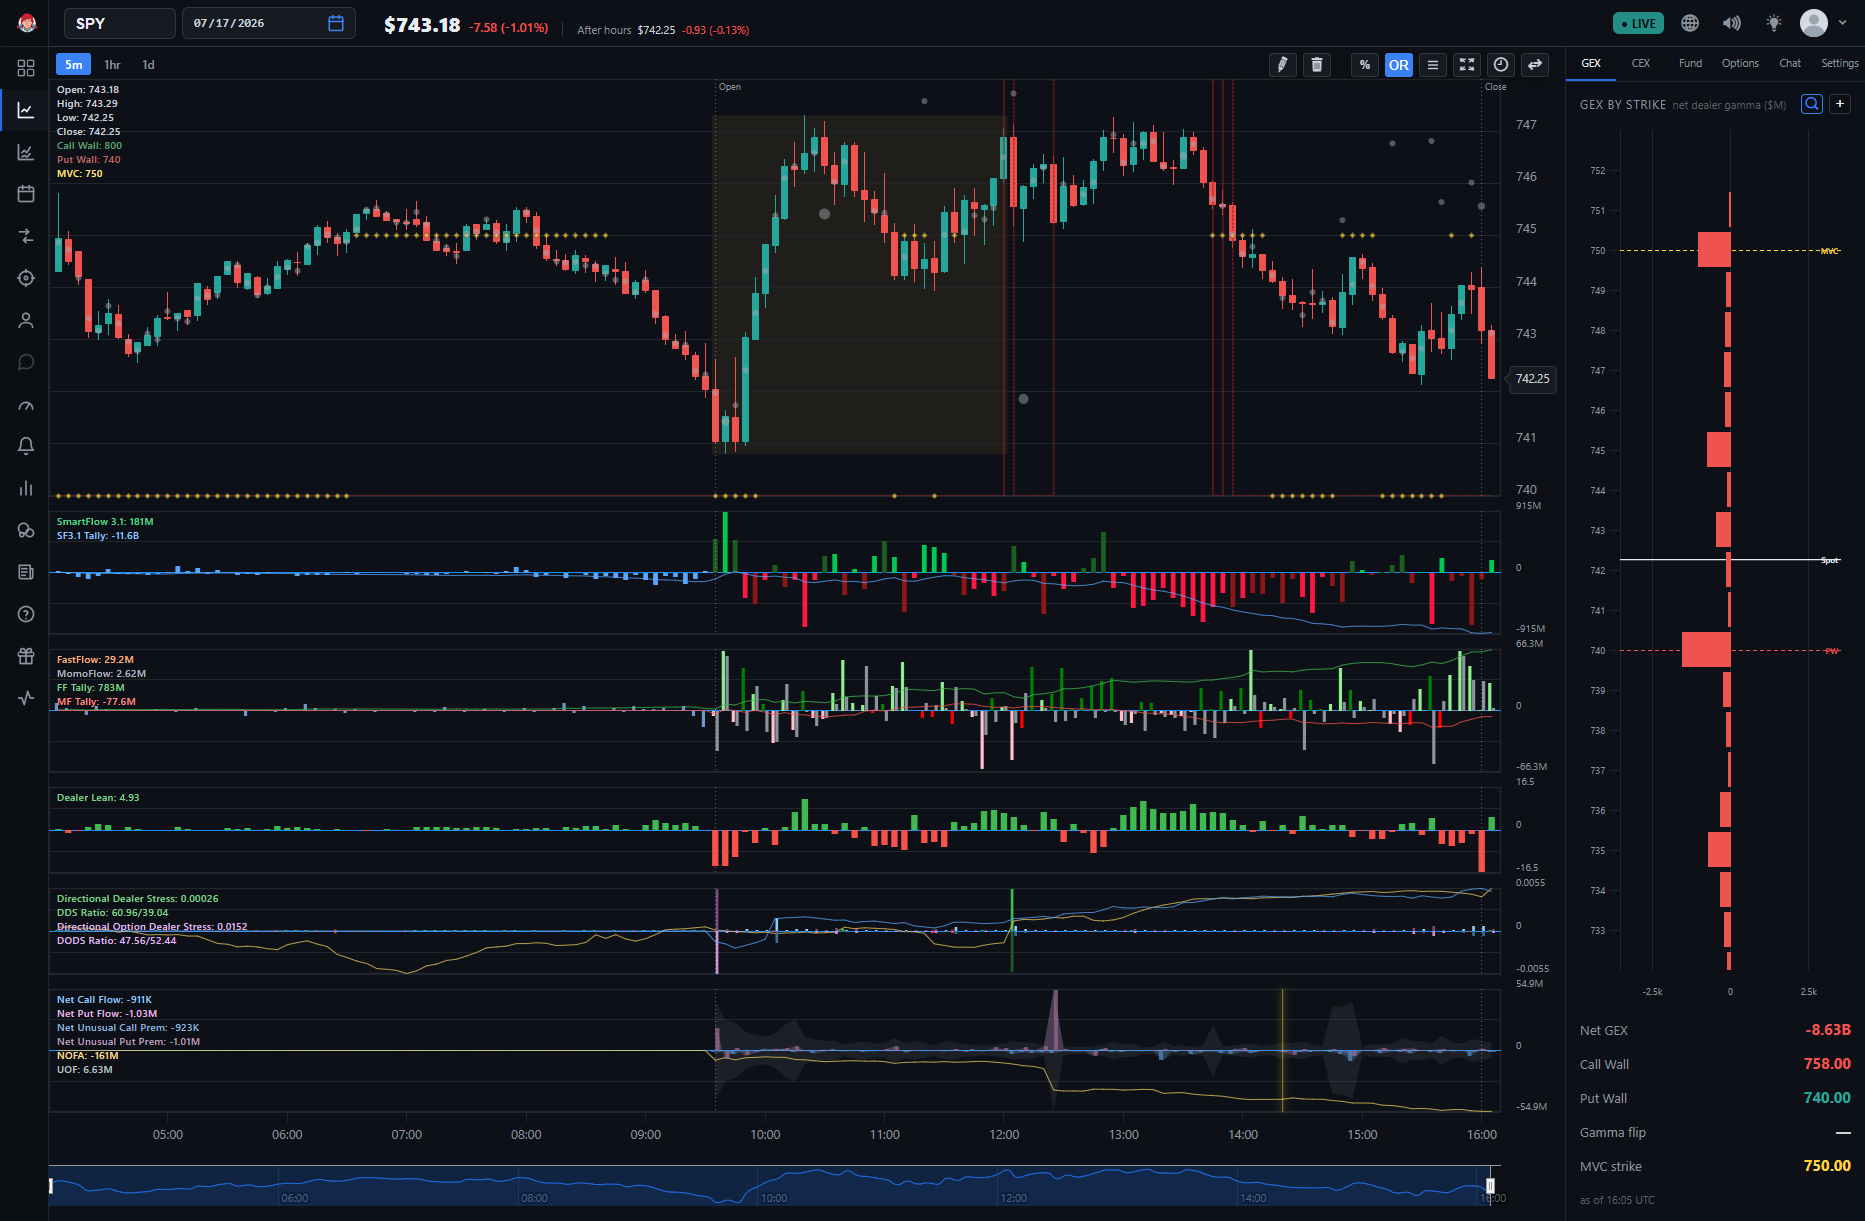
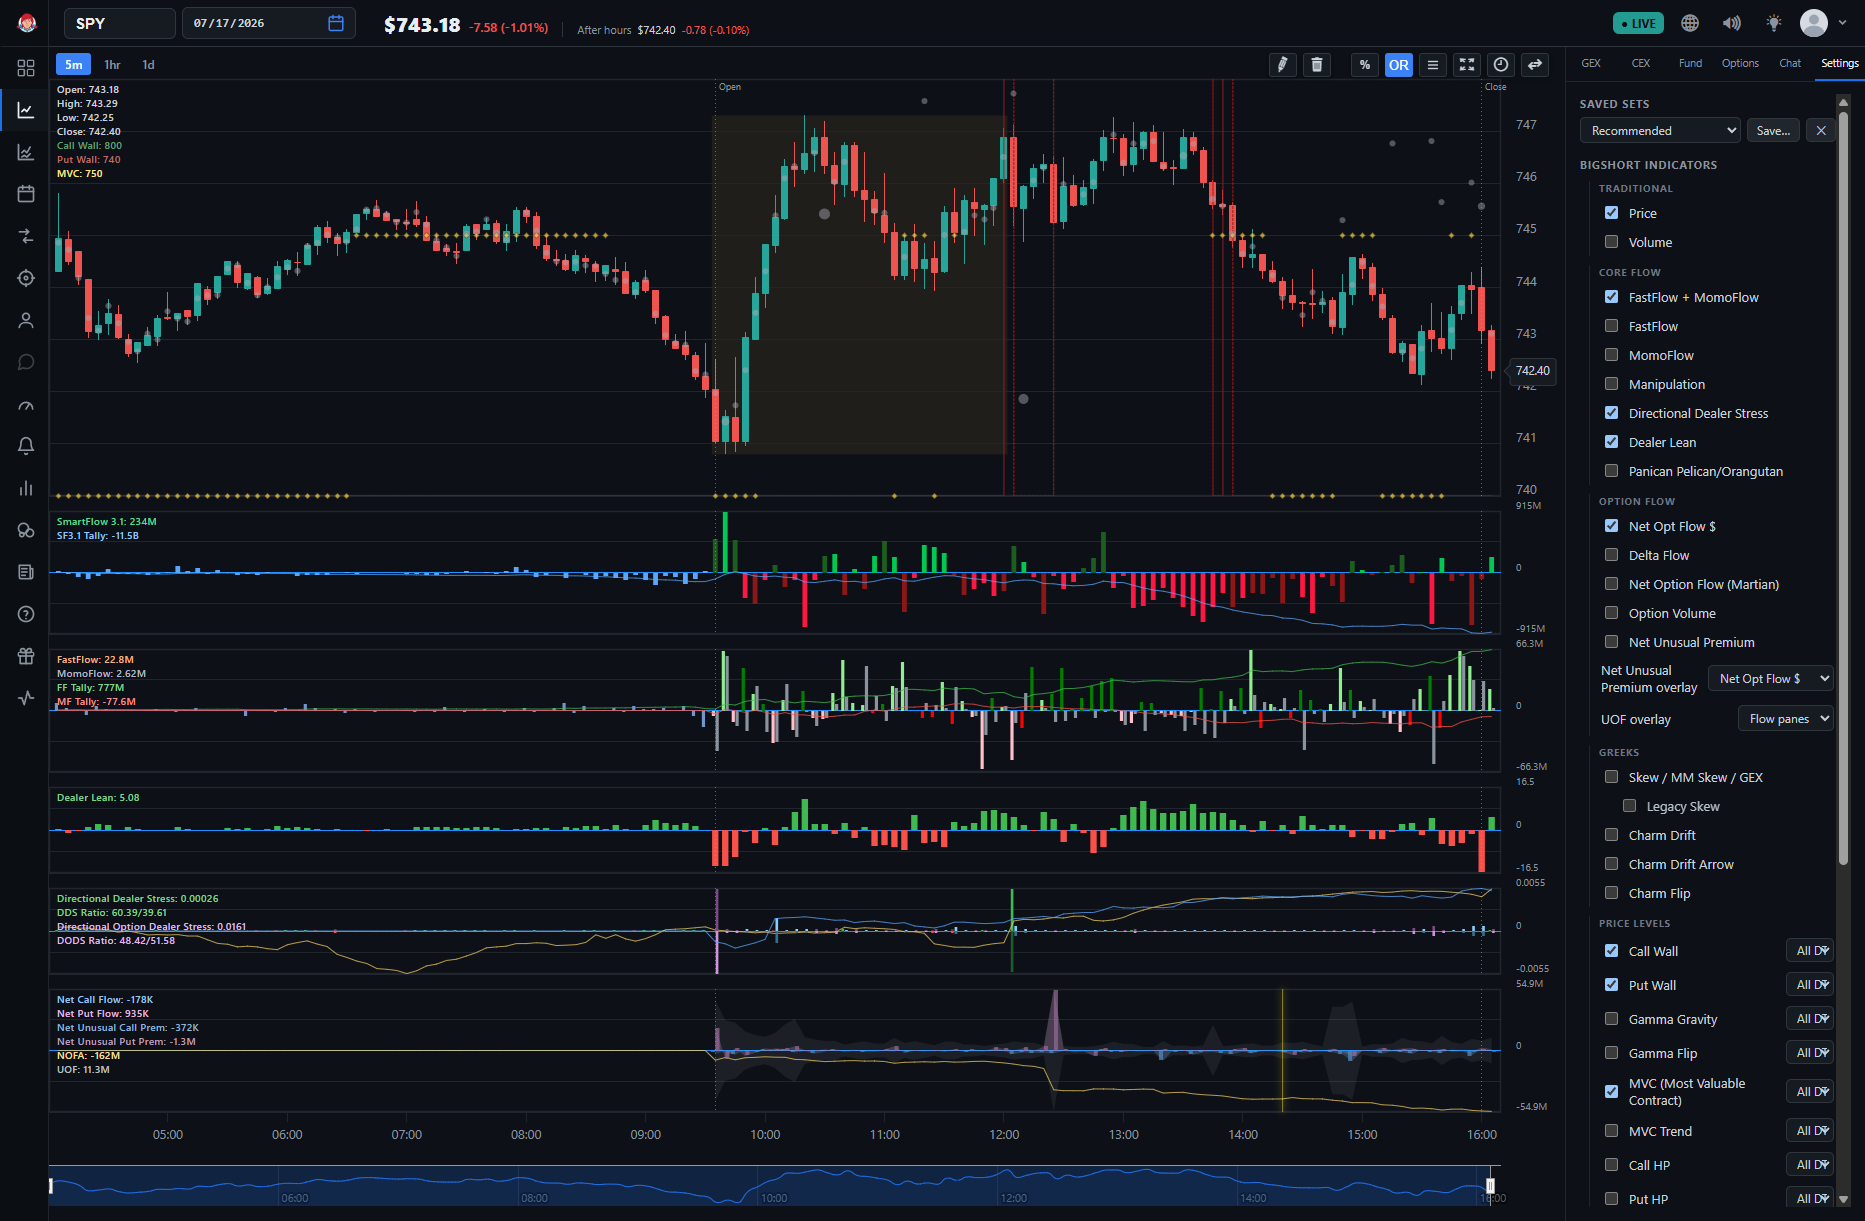
Full guide: The Main Chart
M2 (Elite Indicator)
M2 is a general market-fragility gauge (RC1 = institutional pressure, RC2 = crowd flow), usable any session — one community use-case is reading it around quarterly earnings, but that's not its core function.
M2 (shown as M2 RC1 + RC2) is a premium, top-tier BigShort Elite indicator rather than a standalone tab. Enable it from ⚙️ Settings → BigShort Elite Indicators on either the main Chart or the UF Chart.
UF Chart (UltraFlow)
The UF Chart (previously UltraFlow) aggregates every constituent ticker of an index into one holistic view — the collective flow of dollars, volume, and momentum across, for example, all 500 companies in the S&P 500 at once — so you can spot trends, manipulations, and divergences a single stock or ETF can't reveal. Load one by going to the UltraFlow Tab, and note that UF also includes Similarity Search (SimSearch), which scans an index's full history for the days most likely to resemble today.
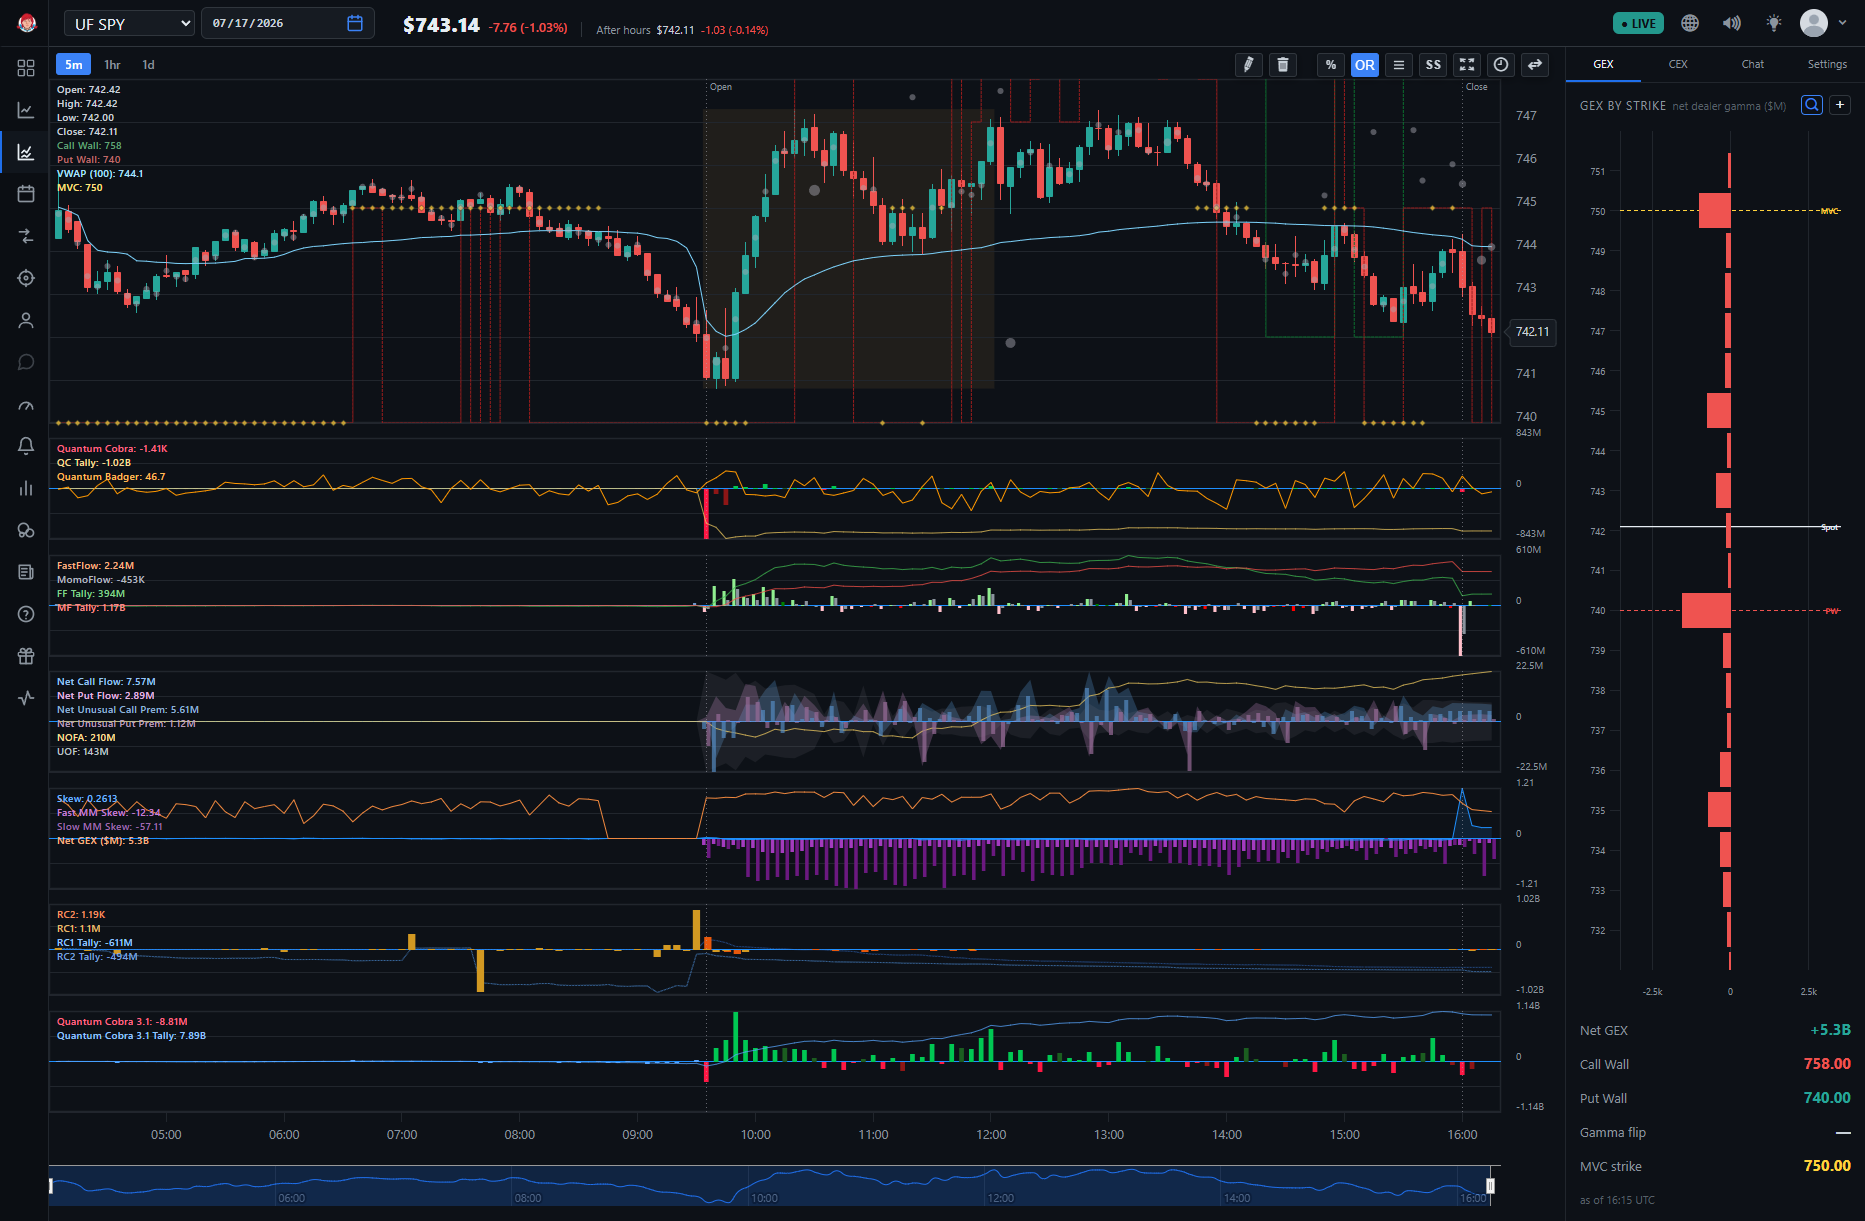
Full guide: Ultraflow (UF) Chart
GEX (Gamma Exposure)
GEX (Gamma Exposure) represents net changes to delta exposure across the market, plotted at every strike along with the critical price levels. In v2 it's not a separate tab: open the GEX side panel from the Chart's right-hand panel (GEX · CEX · Fund · Options · Chat · Settings) for the net gamma exposure at every strike on the hovered bar, and find the same key levels (Spot, Walls, Flip, MVC) as on-chart indicators under ⚙️ Settings → Price Levels and ⚙️ Settings → Greeks — see Key Concepts and Indicators.
Full guide: Gamma, Dealer Hedging, and Why Price Reacts at Options Levels
Seasonality
The Seasonality tab shows SPY's historical performance broken down by calendar date and day of the week over the past 30 years, helping you spot recurring patterns for a directional bias. It's a weaker force than real-time indicators, so use it for confluence — for example, November 24th is historically one of the most bullish trading days of the year, with an 83% Positive Close (SPY has closed higher 83% of the time on this date) and a +0.73% Average Return (SPY has averaged a 0.73% increase on this date historically).
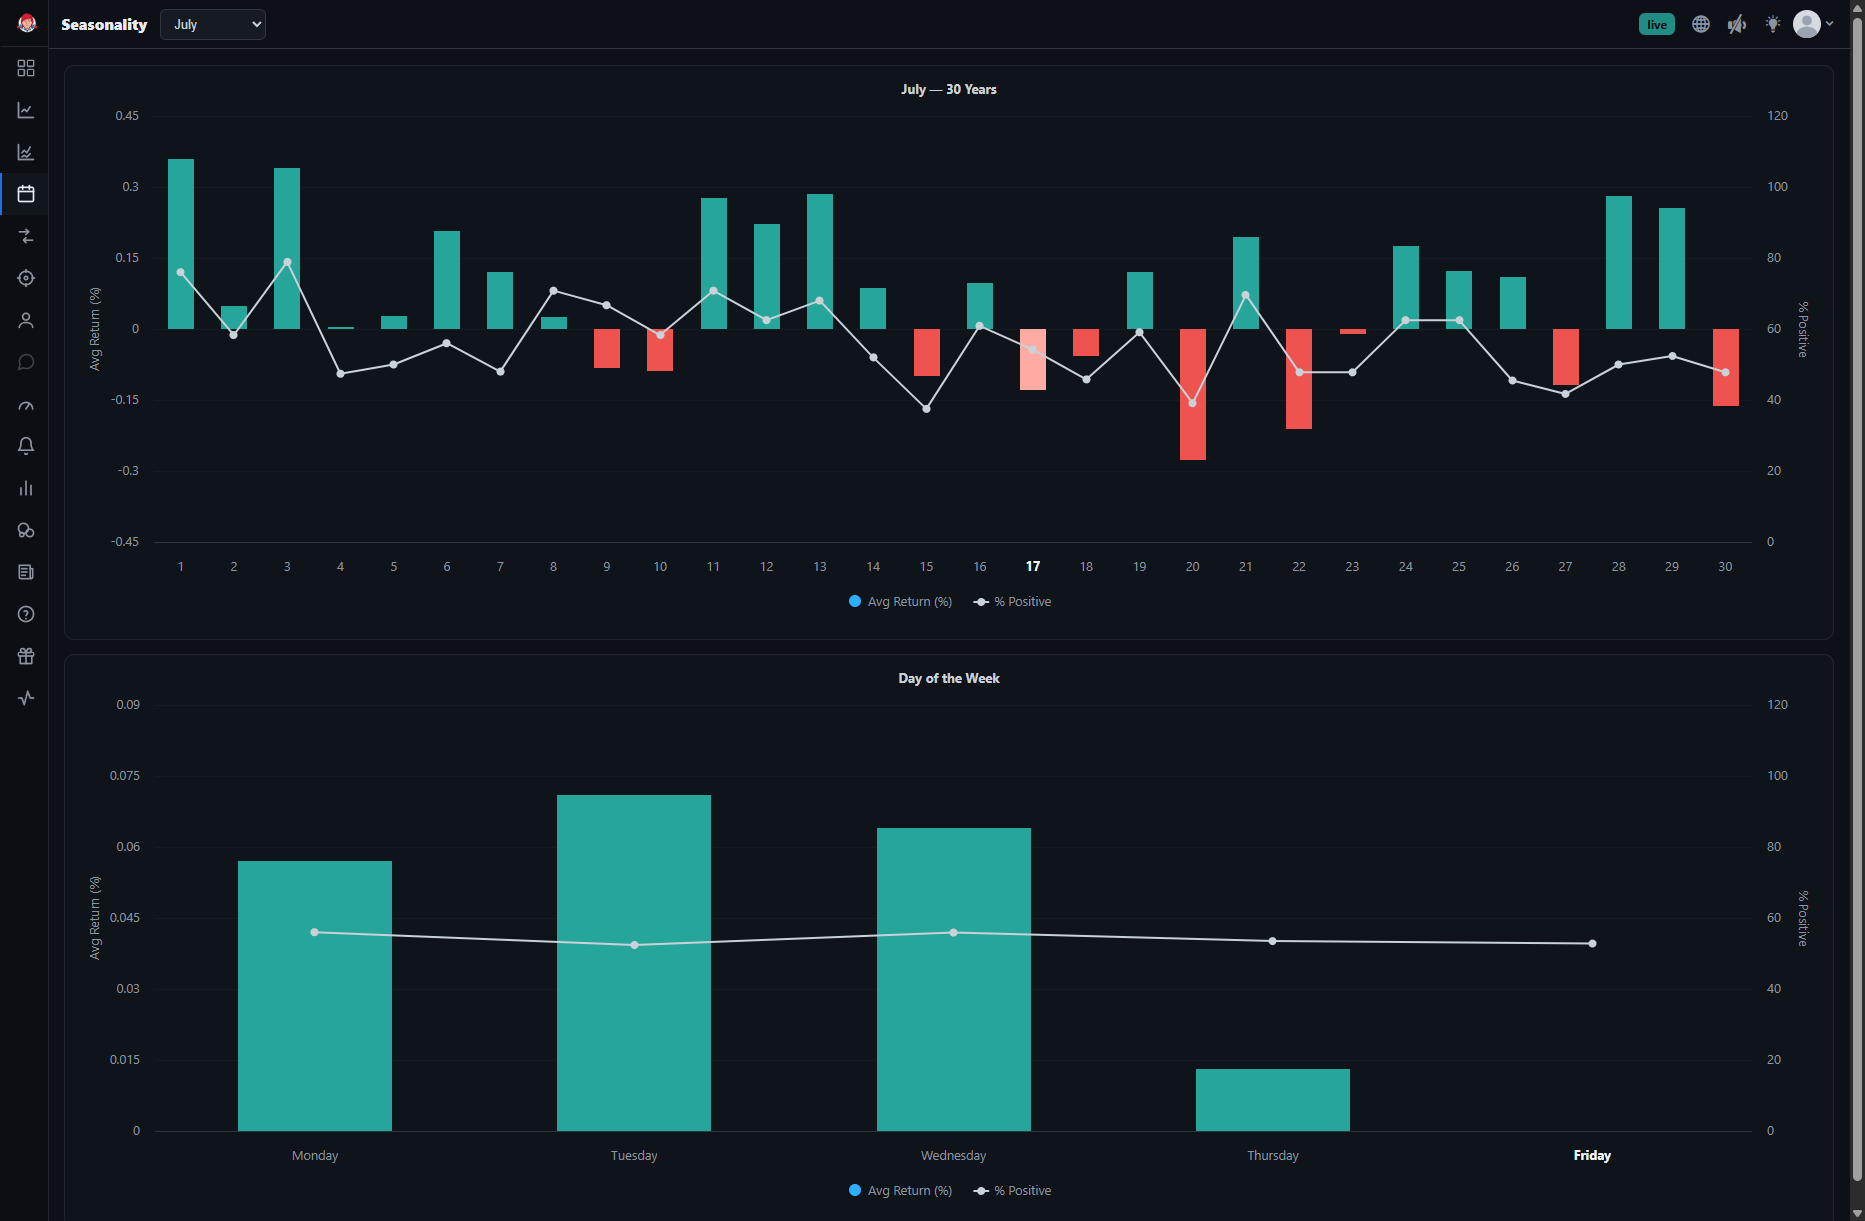
Full guide: Seasonality Tab
OptionFlow
OptionFlow lets you explore large and/or unusual option activity for any ticker and date, and every trade is scored by proprietary BigShort algorithms as bullish, bearish, or no sentiment to hint at what it says about the stock. Filters in the upper-right narrow the table — for example, to flows expiring within a month of today.
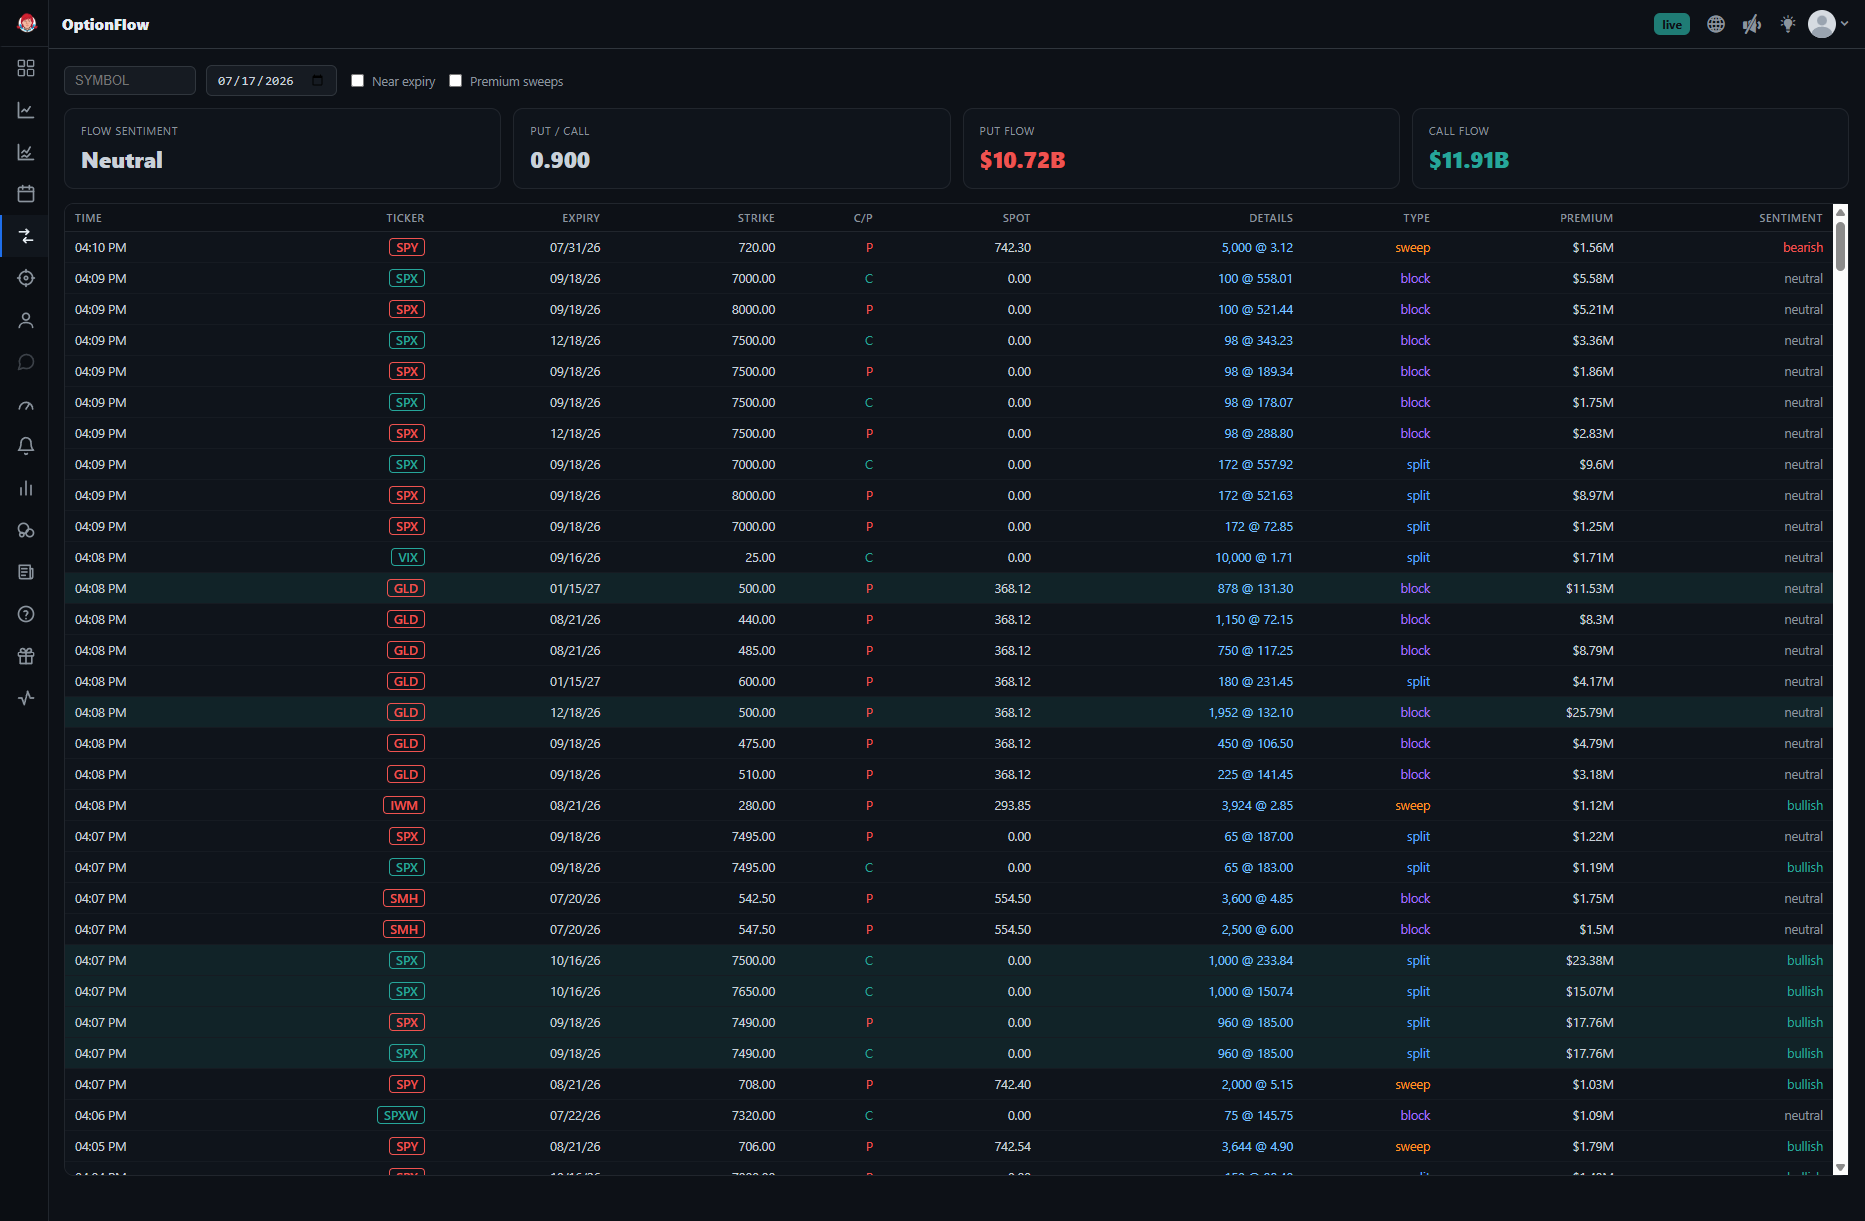
💡 Tip: A condensed version of this OptionFlow data can also be viewed on the Chart by opening the Options side panel from the chart's right-hand panel.
Full guide: OptionFlow Tab
Dark Pools
Dark pools are off-exchange venues where large institutional trades execute away from the public tape. Dark pool data is accessible both on the main chart — where prints appear as grey dots directly on the Chart's price pane, as part of the Price indicator (hover a dot to see its price and volume; an optional audio alert can announce new prints) — and via the standalone DarkFlow tab. Clusters of dots often act as support and resistance.
To best understand dark pools and how to use them in your trading strategy, we recommend reading our complete article on Understanding Dark Pools.
Squeeze Meter
The Squeeze Meter is a proprietary read on SPY UF data: heavy shorting means those shorts must eventually be bought to cover, which builds bullish pressure that tends to show up in the latter half of the day. This is a Honey Badger Day (HBD), completely unique to BigShort and typically a high-probability setup — ~90% for 3-HBD! Read more about HBD here.
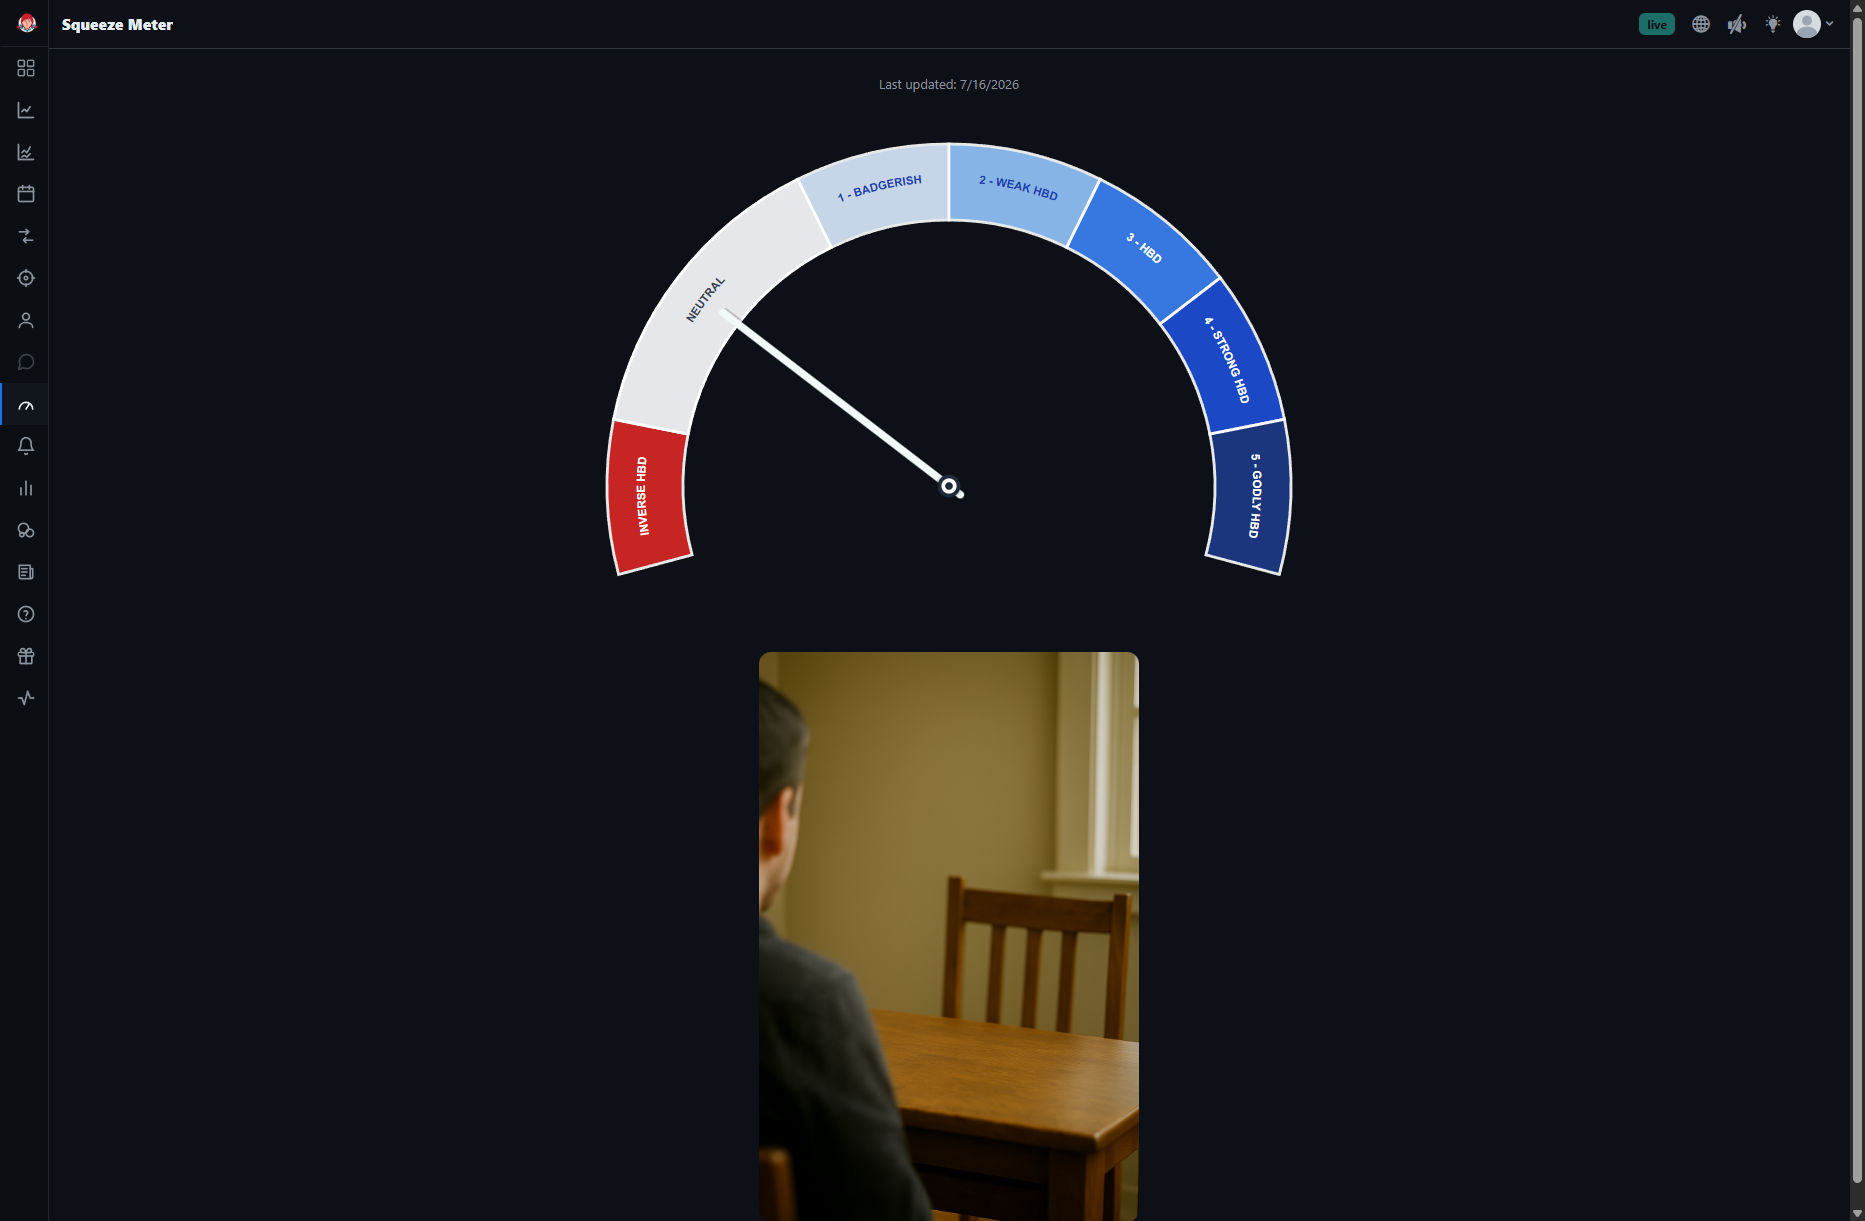
Full guide: Squeeze Meter Tab
Spodin
Spodin (short for Spear of Odin) is our proprietary closed-system alert: set personalized price alerts for any ticker and get a call or text the moment a level is hit, so your intentions stay private instead of being exposed to market makers the way pending limit and stop orders can be. Open it from the side menu, add your phone number, then add, reset, edit, or delete alerts per ticker.
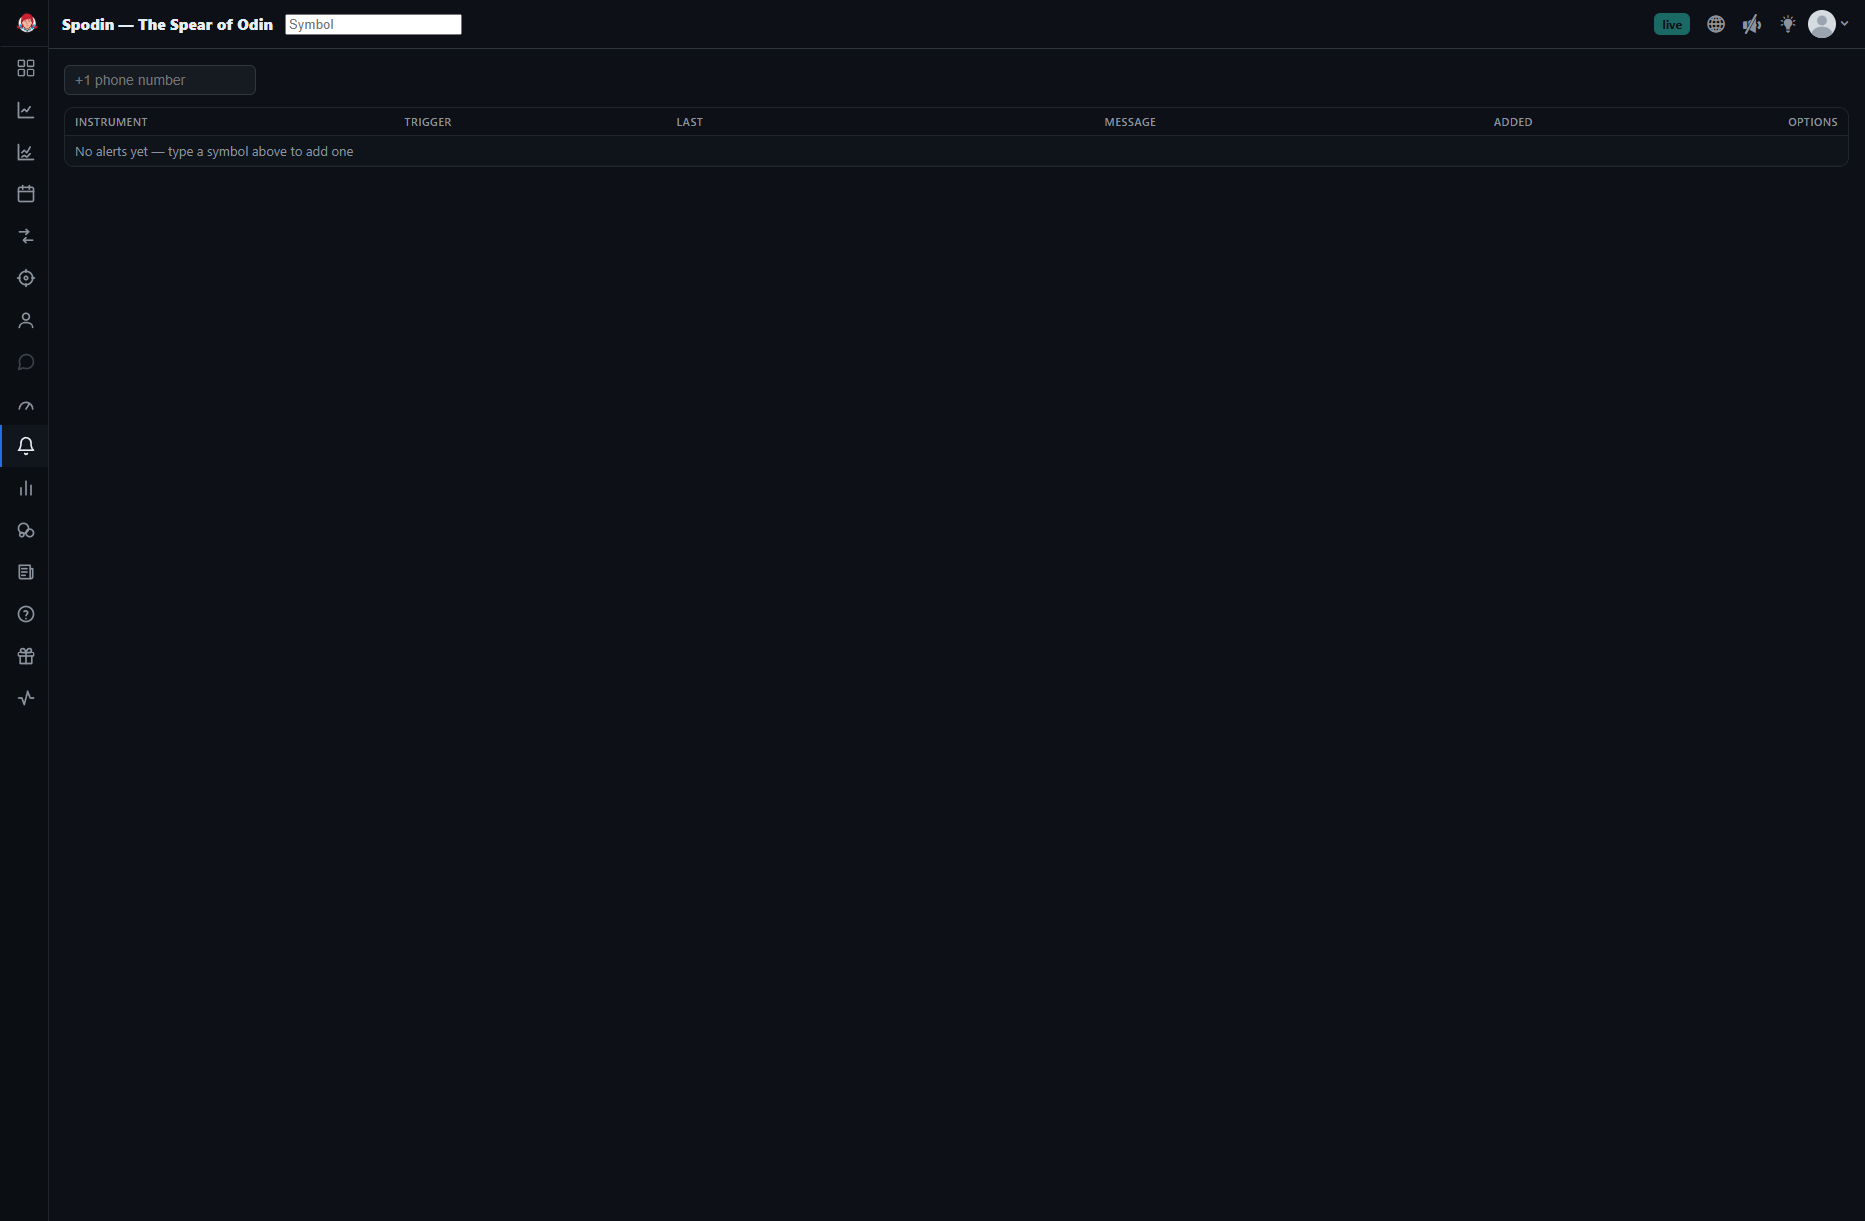
Full guide: What the Hell Is Spodin?
Short Volume
The Short Volume tab centers on Short Exempt (SE) — a designation that sidesteps the short sale restriction's uptick rule and mostly comes from market makers, so historically high SE signals they're out of position and a short squeeze may be building (covering means buying, which drives price up). Switch between its Long/Short Volume, Real Volume, Short Exempt, MSC (Inverse), and MASC views.
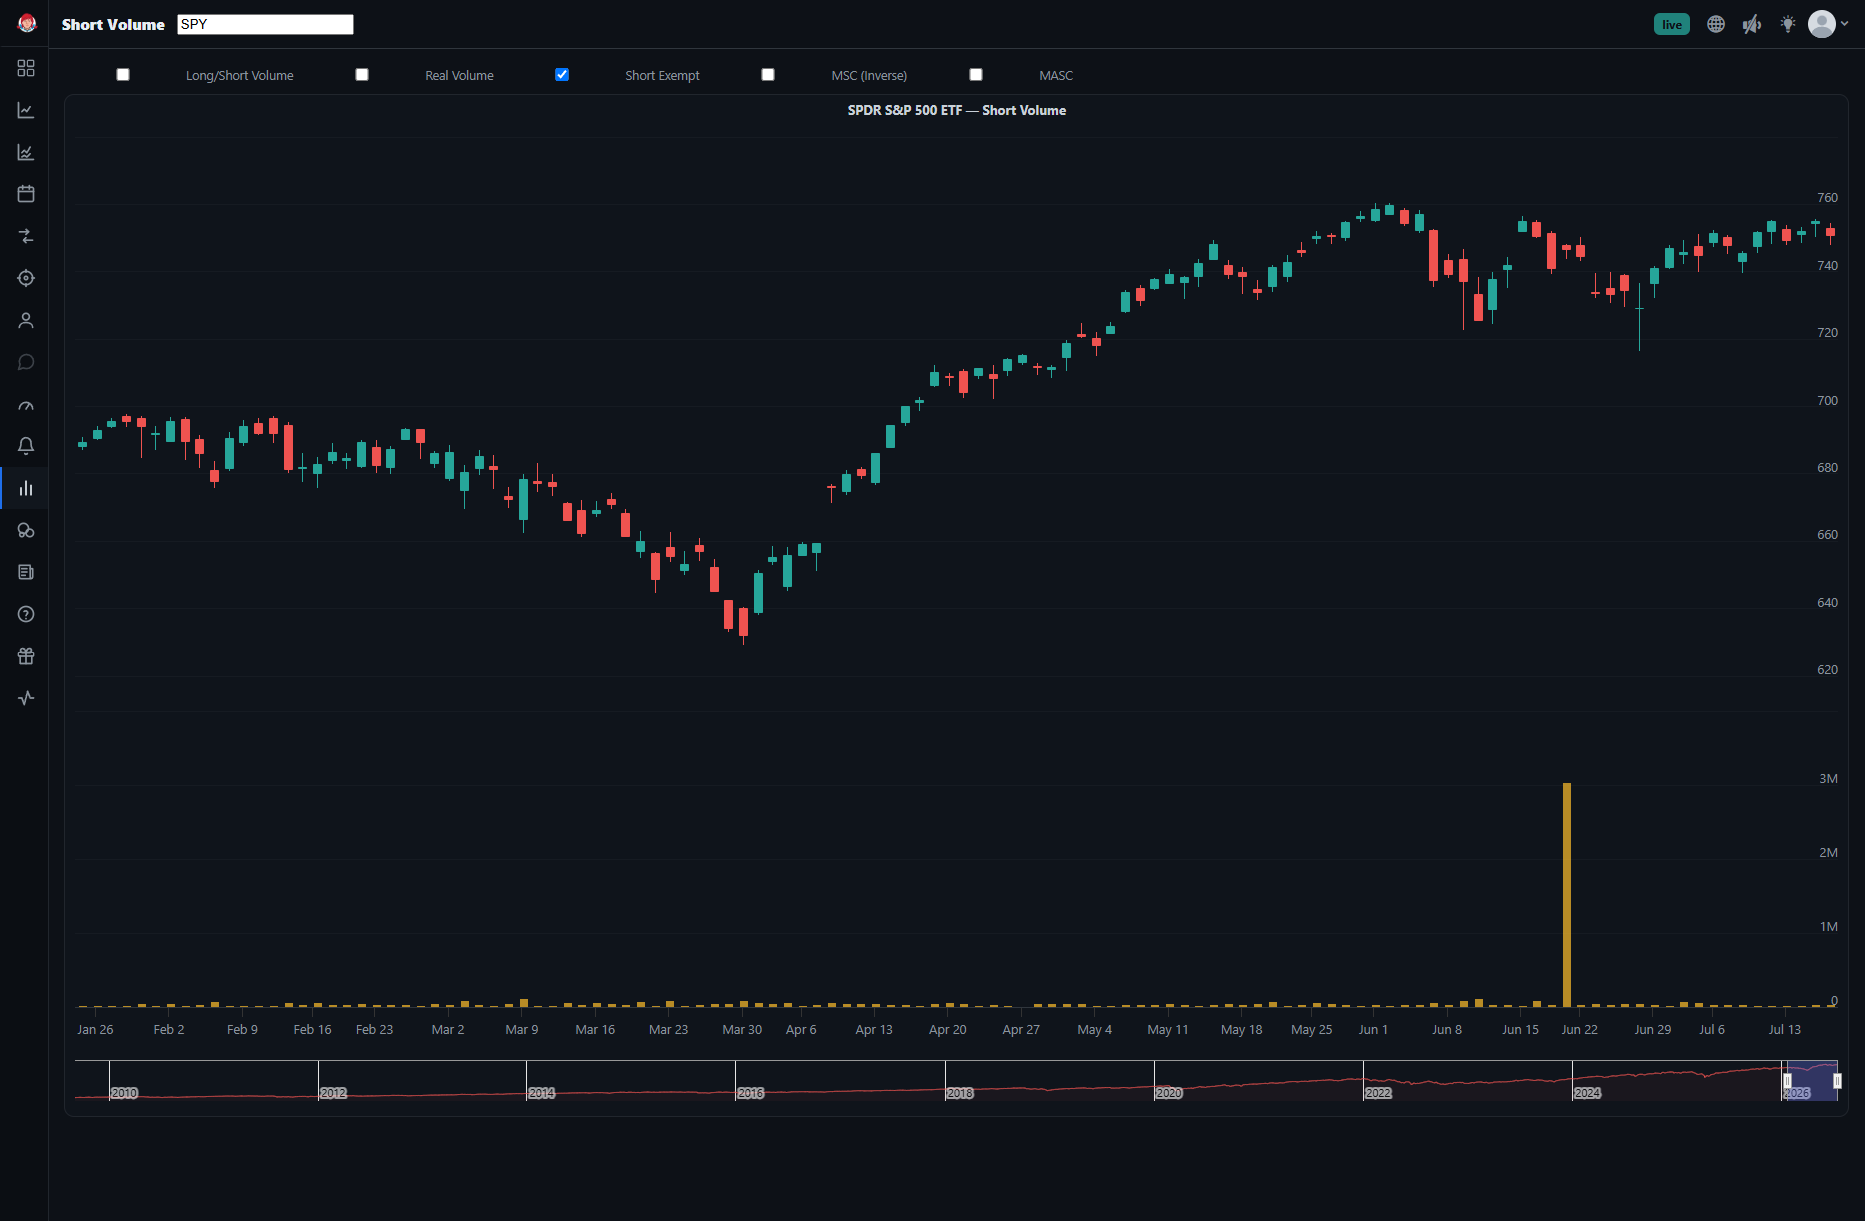
Full guide: Short Volume Tab
Toby Crabel (ORB)
A volatility-contraction / opening-range-breakout scanner (also available as an opening-range shade mode on the Chart), live at app.bigshort.com/toby.
Full guide: Toby Crabel Tab
Insider Trades
SEC Form 4 insider transaction filings, live at app.bigshort.com/insiderTrades.
Full guide: Insider Trades Tab
SocialFlow
Retail social + Polymarket sentiment overlaid on price, live at app.bigshort.com/socialflow (the nav entry currently renders as non-clickable text, so use the URL directly).
Full guide: SocialFlow Tab