BigShort Indicators & Key Concepts
BigShort's indicators aren't all equally load-bearing. This page ranks them in order of importance, then gives each one a brief overview with a link to its full guide — the mechanics, the reads, and how to use it live under that link, not here.
Indicators in Order of Importance
The further down the list, the less power an indicator has to correctly contradict the ones above it. For example, Seasonality can confirm a higher-importance indicator's read, but you'd never want to form a bearish bias from Seasonality alone when HBD, GEX, and Dark Pools are bullish.
Confluence between multiple BigShort indicators happens often enough, often multiple times per day, that you do not need to force trades based on 1 signal — be patient and wait for the higher probability confluent setups.
- Price Action
- Dealer Lean
- Mongoose Days
- Honey Badger Days
- Directional Dealer Stress
- MVC
- Charm Exposure
- Honey Badger Years (rare, ranked low accordingly)
- Dark Pool Prints
- Insider Trades
- SF 3 / SF 3.1
- SE / Momo Shadow Bars / NOF
- MM Skew / GEX (tied)
- Crabel/Zarattini
- SimSearch
- Manipulation (disregard if you're new — Elite-only situational read)
- Gold and Bronze Sweeps
- Seasonality
There's no one-size-fits-all rule for combining them. In some scenarios you read GEX, Dark Pools, and MomoFlow as a collective; in others, one neutralizes another. Most of this comes from screen time and building intuition — be patient, disciplined, and watch for patterns with an open mind.
Price Action
Building a strong foundation in reading Price Action patterns and setups is critical — don't skip this step. See Price Action for tips and guidance, including ChartGame, the tool BigShort built to help you practice it.
Honey Badger Days & the Squeeze Meter
Honey Badger Day (HBD) is one of BigShort's most powerful day-trading signals — a rare setup that often leads to explosive moves, applying specifically to SPY.
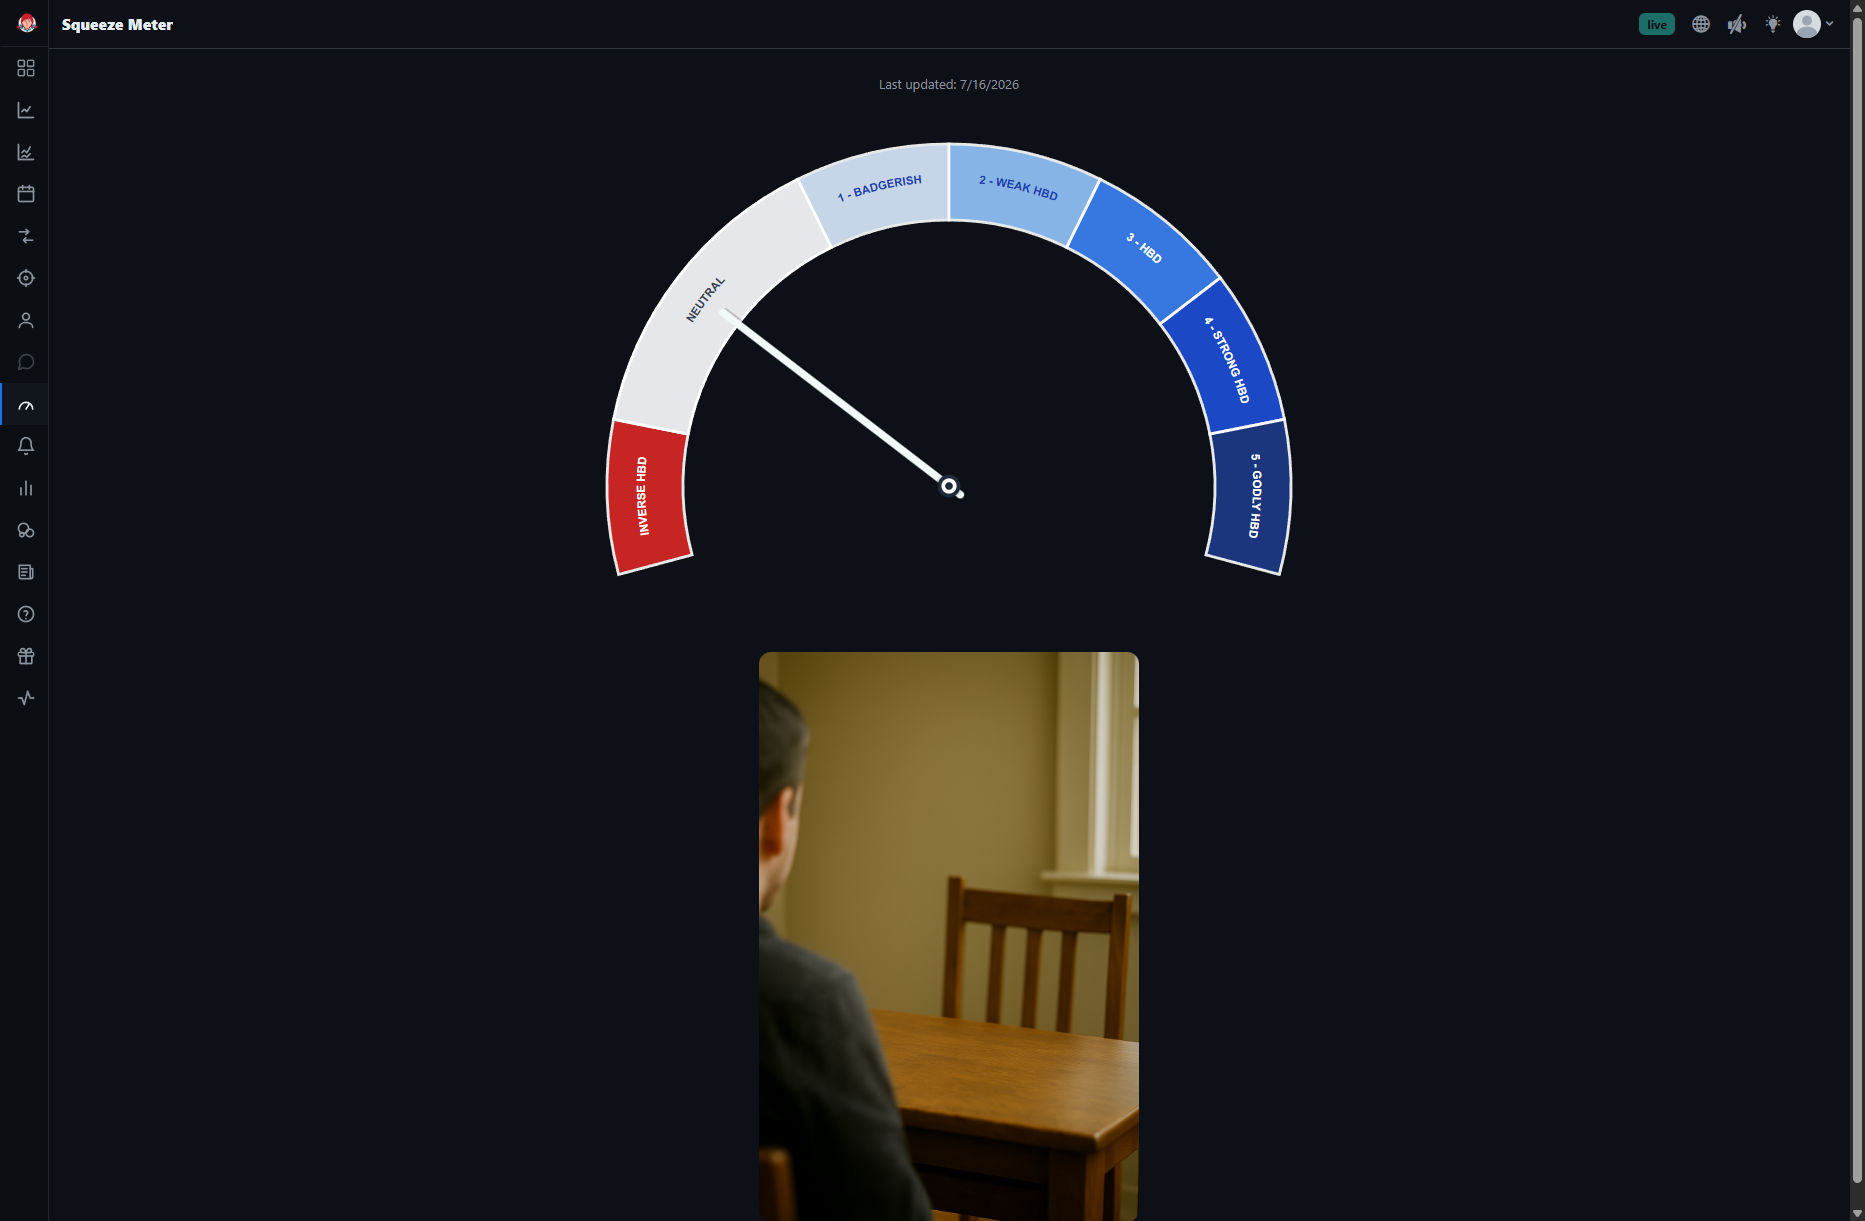
Full guides: Squeeze Meter Tab (where to find the reading) and What is a Honey Badger Day and How To Trade It (how to trade it, with a worked example).
Dark Pools
Dark Pools are private venues where large institutions place orders away from public exchanges. BigShort plots those trades in real time as grey dots on your chart, part of the Price indicator — no separate checkbox. Clusters matter more than single prints; a cluster below price tends to act as a floor, a cluster above tends to act as a ceiling.
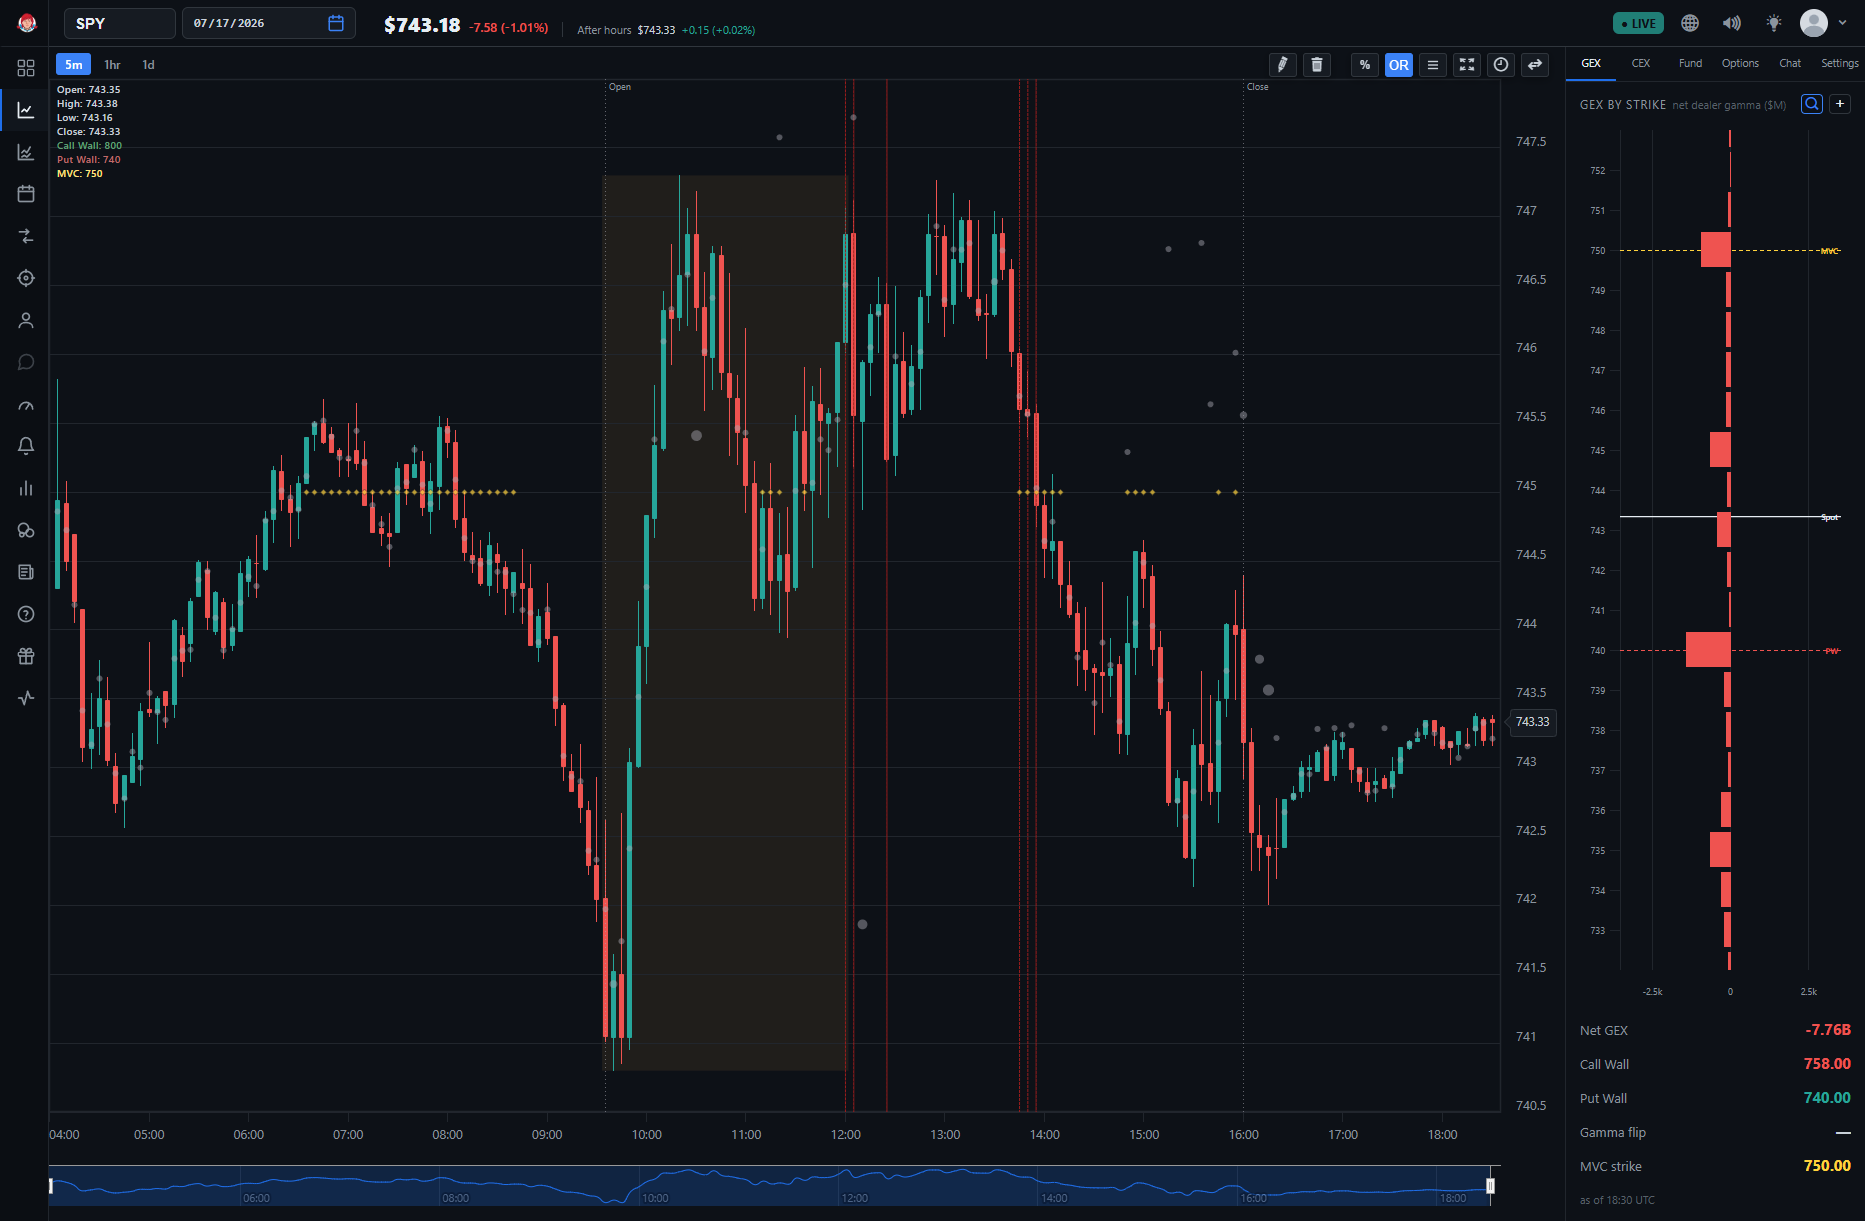
Full guide: Understanding Dark Pools and DarkFlow in BigShort
GEX (Gamma Exposure)
GEX is the cumulative gamma held by dealers, and it shapes price by creating dynamic support and resistance where they must hedge — visualized on BigShort as the Call Wall, Put Wall, Gamma Gravity, MVC, and the Gamma Flip regime line.
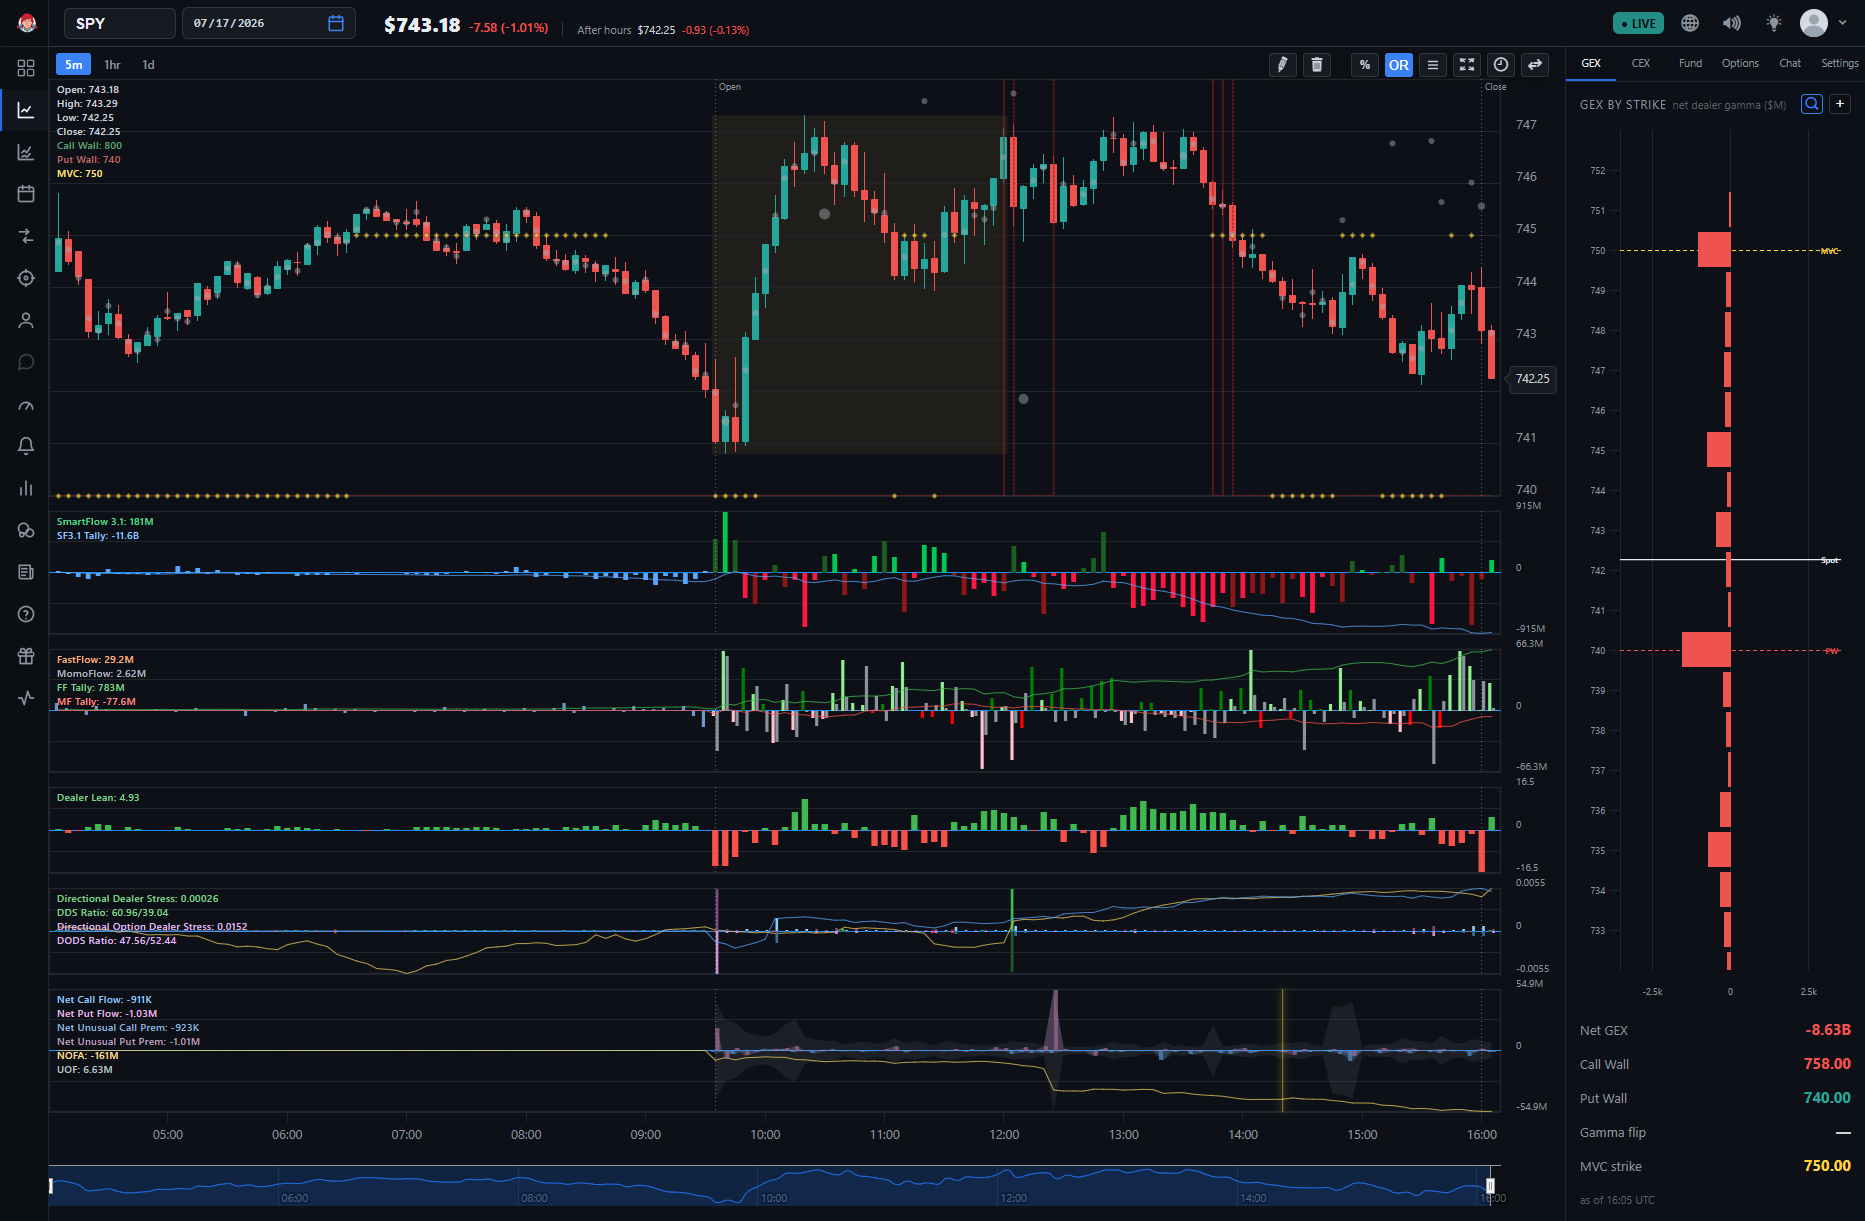
Full guide: Gamma, Dealer Hedging, and Why Price Reacts at Options Levels — the full mechanics, the GEX side panel, and every level.
Order Flow: FastFlow & MomoFlow
BigShort splits raw order flow into two panes: FastFlow (fast, automated, algorithmic activity) and MomoFlow (slower, human, momentum-driven activity — often an inverse indicator, since crowded retail positioning is exactly what dealers fade). As a new trader, focus on MomoFlow first; FastFlow is harder to front-run and safe to set aside until you're more comfortable.
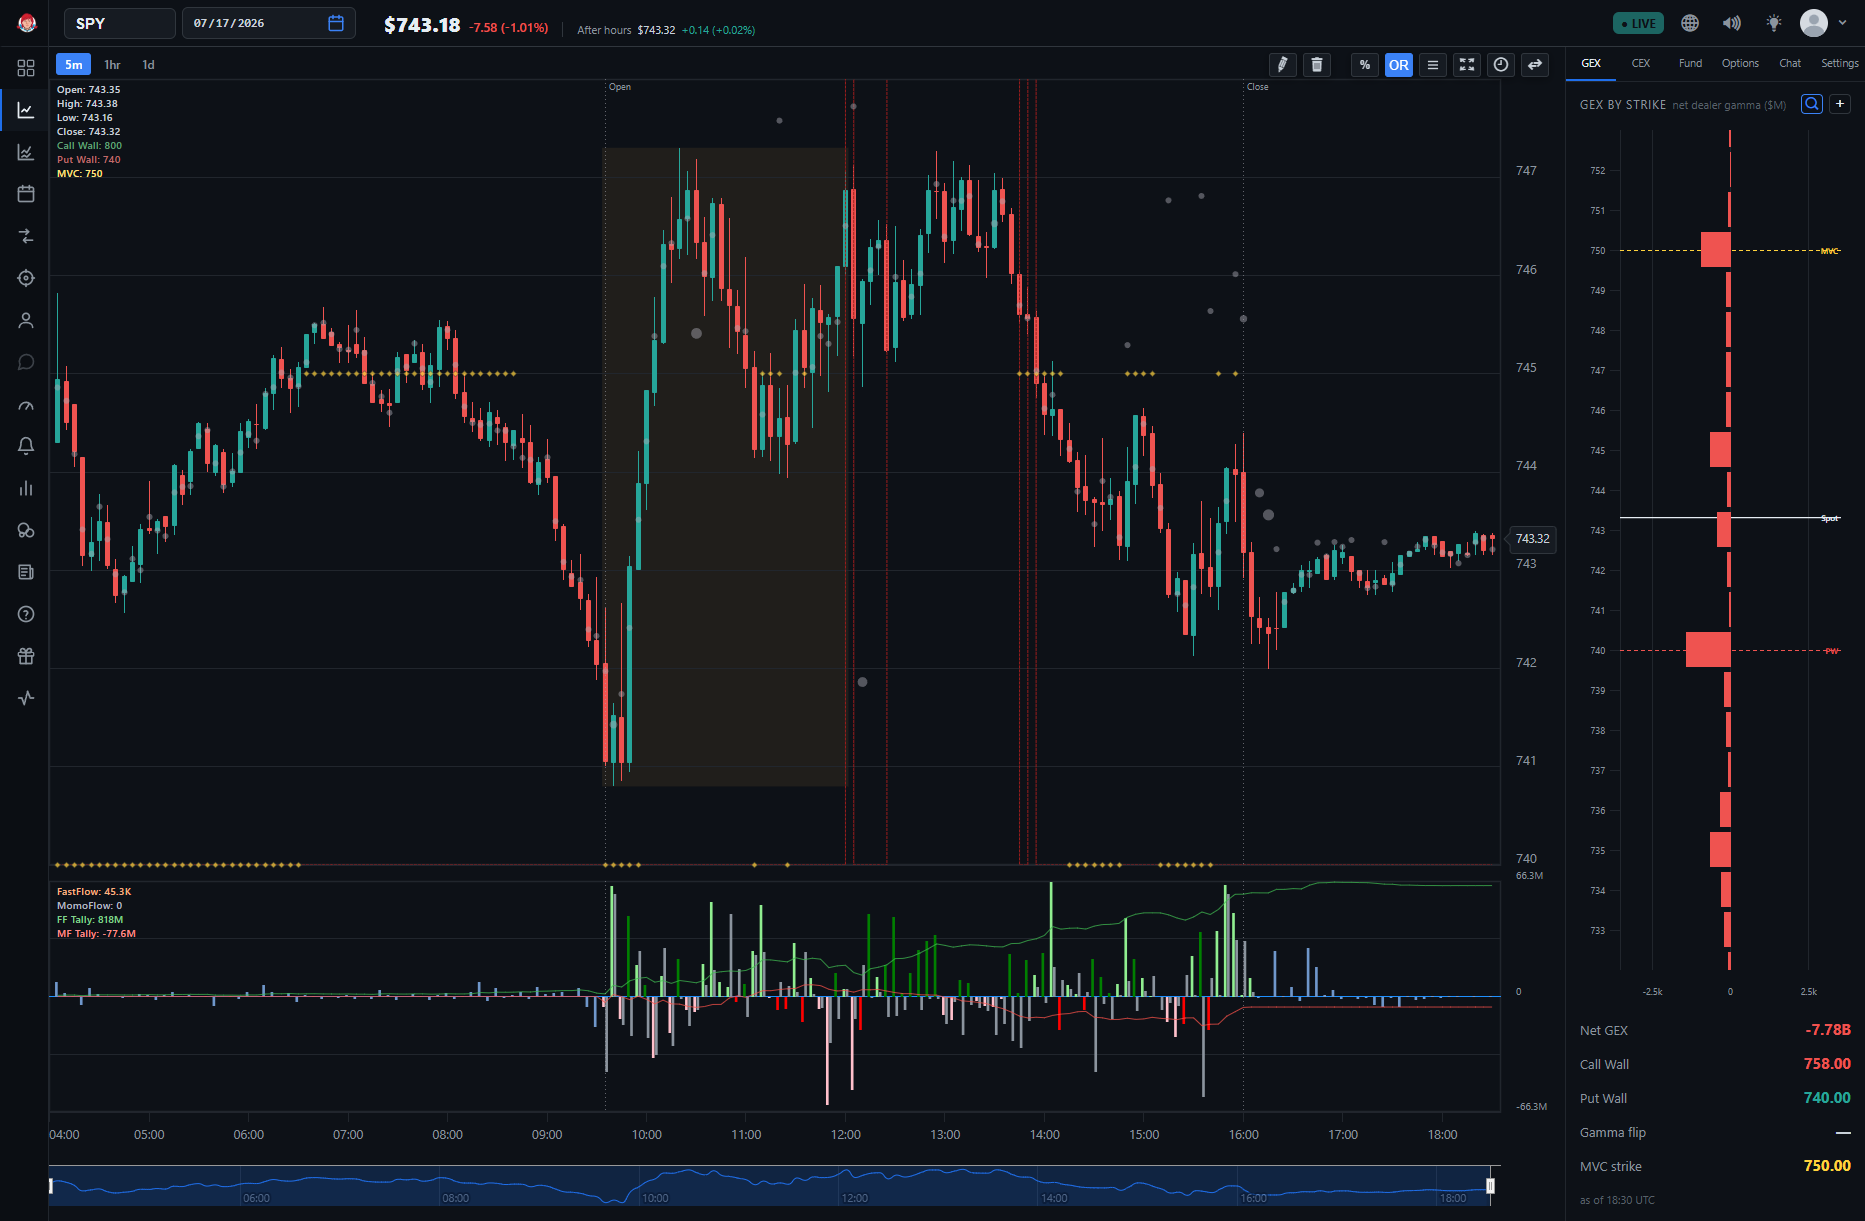
Full guide: Understanding FastFlow and MomoFlow Indicators — the color conventions, the alignment/shadow-bar mechanic, and exhaustion reads.
SimSearch (Similarity Search)
Similarity Search finds the historical days that most resemble today's intraday pattern and shows how they played out — a lens available nowhere but at BigShort.
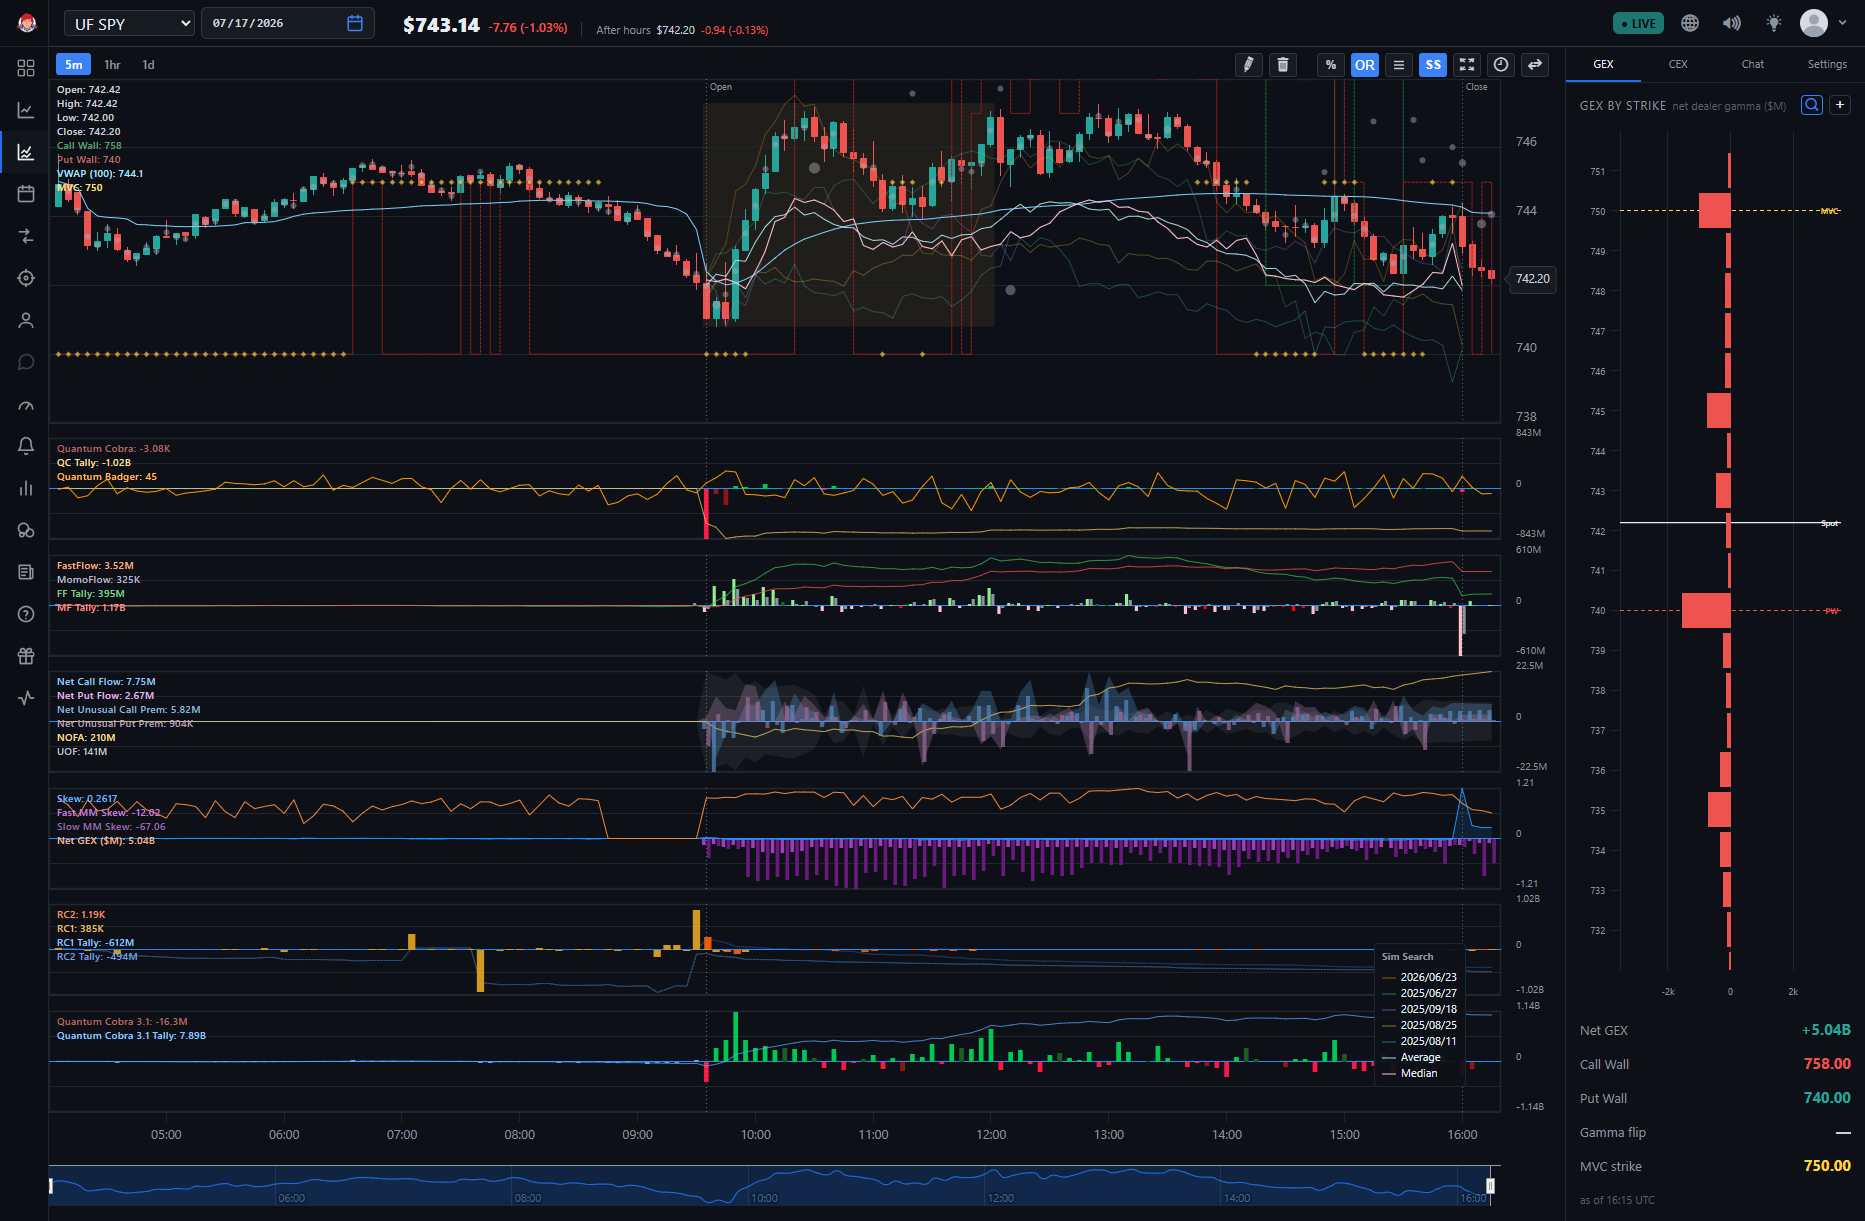
Full guide: Similarity Search (SimSearch)
NOF (Net Option Flow)
Net Option Flow (NOF) reads real-time options activity — dollar-weighted, buy-versus-sell — to show where market sentiment is leaning, plotted directly in line with the price chart. Golden and Bronze vertical lines mark large, unusual option transactions analyzed as bullish or bearish.
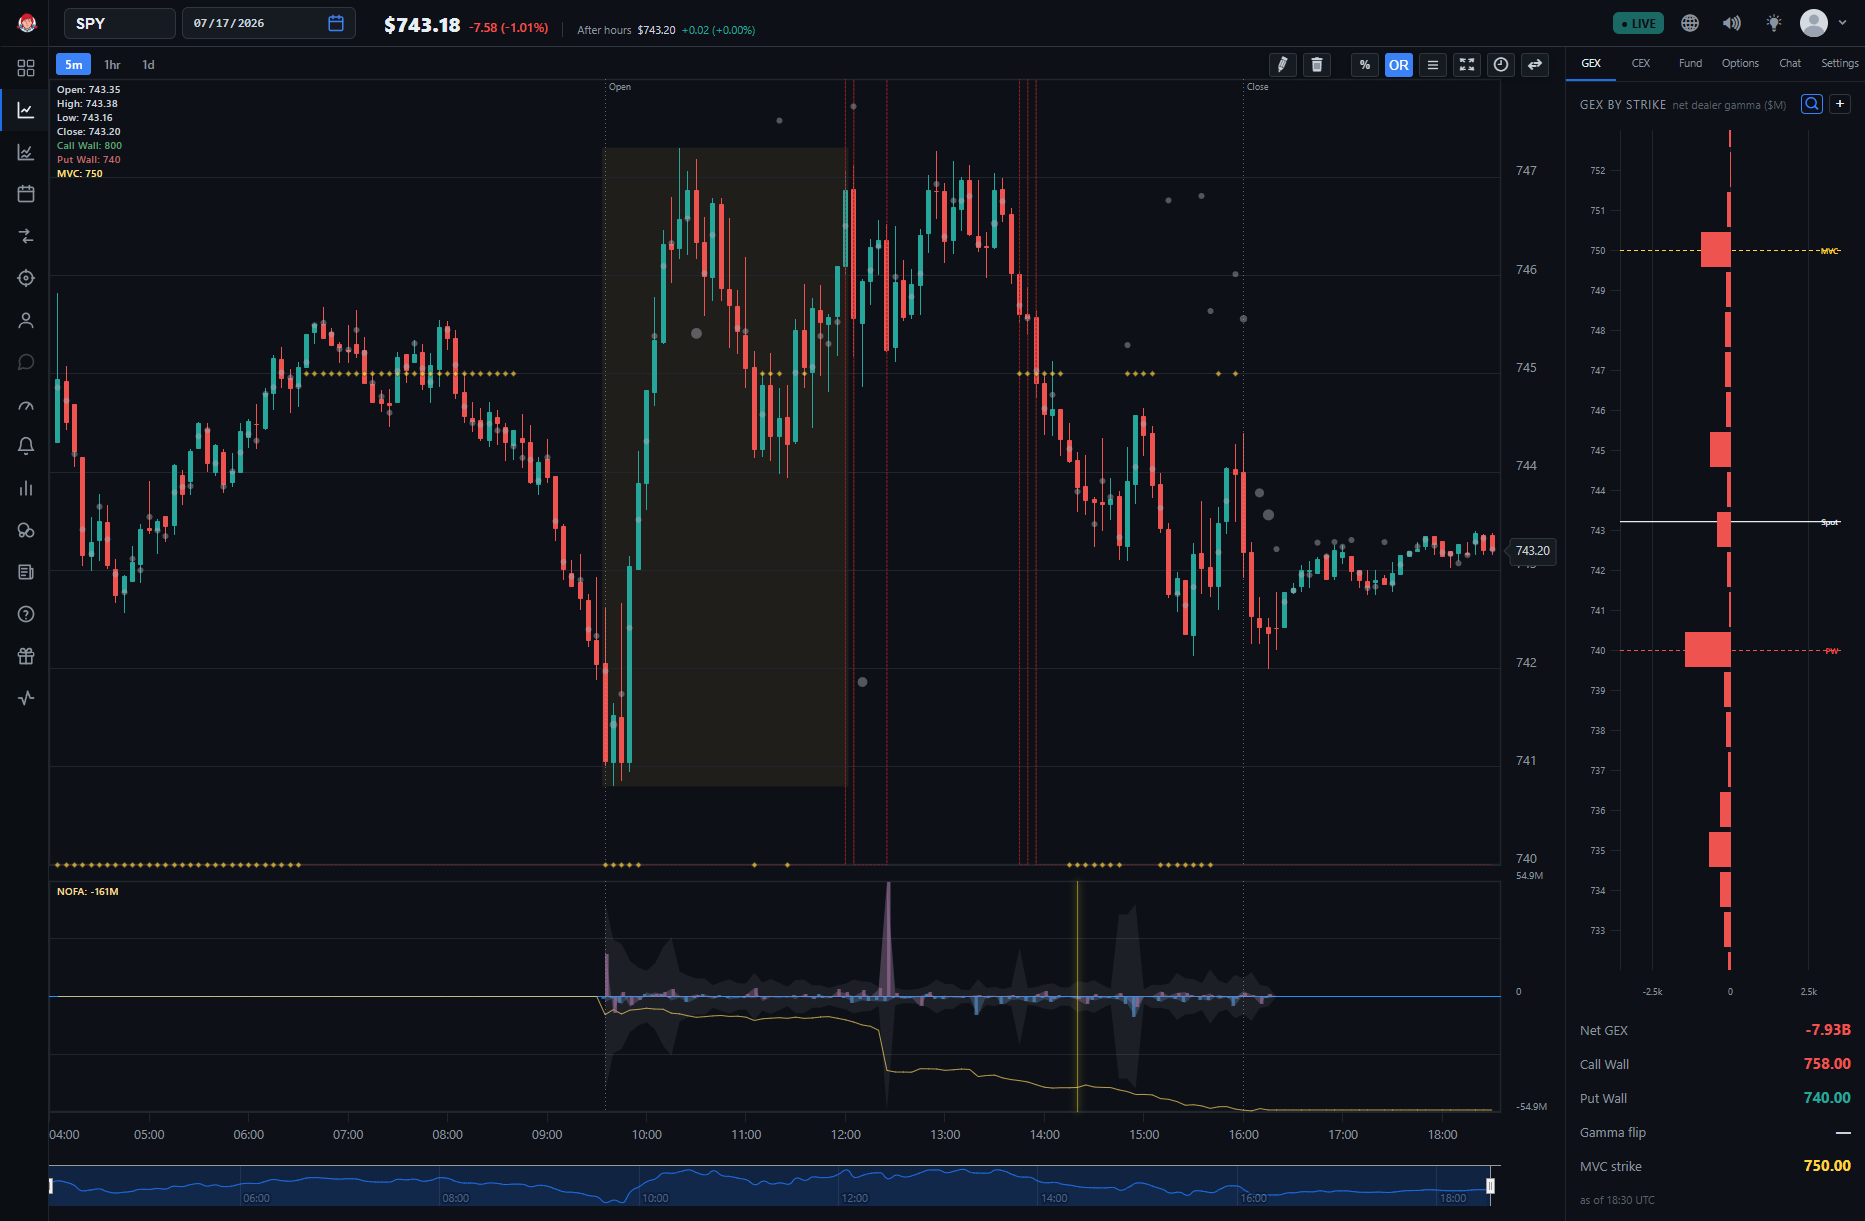
Full guide: Net Option Flow: A Complete Guide — the three metrics, the sweep/block distinction, NOF exhaustion, and Martian NOF.