BigShort Charts & Navigation
Before getting into the juicy stuff, let's quickly review the basics of navigating charts within BigShort. If you take a few moments to open the main Chart at app.bigshort.com/chart/SPY and click along to this section, it will help you fully understand the detailed BigShort Indicator sections.
BigShort v2 has one chart. Everything the old FastFlow and FF Segregated tours used to spread across separate screens now lives here — you simply switch indicators on and off from ⚙️ Settings (grouped by type) and save your favorite layouts as Saved Sets.
Charts & Chart Settings
Charts appear on many pages in BigShort. If there's a chart, the settings and key behaviors are described here. See the corresponding section in Key Concepts & BigShort indicators for more detail.
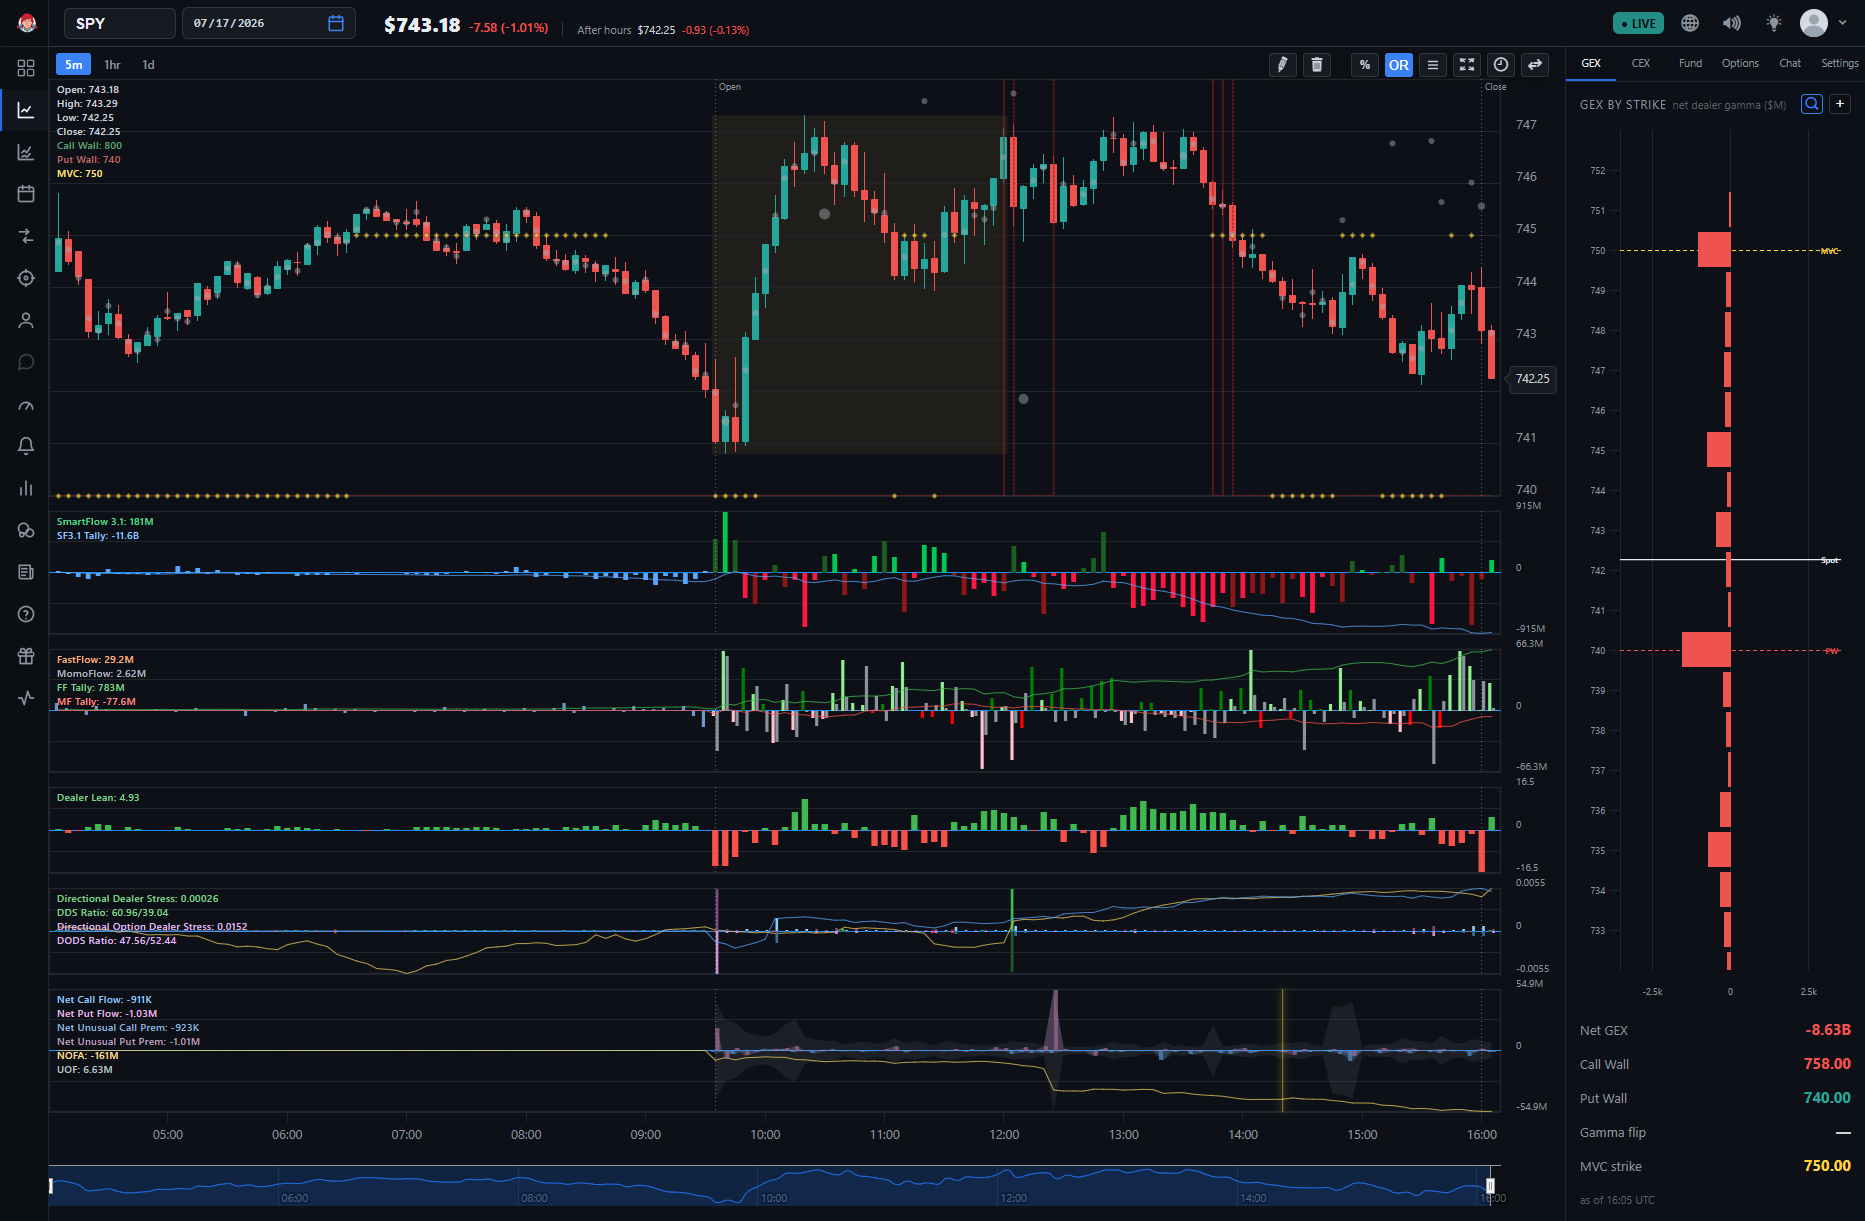
The default (Recommended) chart shows several indicators at once on a single screen — Price with dark-pool dots and Price Levels lines, FastFlow + MomoFlow, Net Option Flow, and the GEX side panel — so one view covers most of what's described below.
Candlestick Pane
The Candlestick Pane is the largest pane on the platform because it shows the Price Action—our most important indicator. Monitoring Price Action helps you understand what the stock is doing in real time.
Other key indicators you'll see in this pane include:
-
Dark Pool Prints – shown as grey dots on the price pane. They're part of the Price indicator itself, with no separate checkbox to switch them on, and are also available via the standalone DarkFlow tab; hover over a dot to see its price and volume. Full mechanics: Understanding Dark Pools.
-
GEX (Gamma Exposure) & Walls – the green line is the call wall, the red line the put wall, and the turquoise line the Zero Gamma Flip. The walls toggle under ⚙️ Settings → Price Levels, GEX itself lives in the Greeks group, and you can read gamma exposure by strike in the right-hand GEX side panel. Full mechanics: Gamma, Dealer Hedging, and Why Price Reacts at Options Levels.
This is just a preview of the indicators available in this pane. See BigShort Indicators & Key Concepts for how each one works and how it signals potential trades.
Ticker & Date Selector
In the upper-left corner, you'll see the Ticker & Date Selector. This is where you enter a stock ticker and choose the Session date (Month / Day / Year, with a calendar picker) for the market data you want to view. We currently support all tickers from the S&P 500 and Nasdaq.
For example, you might select SPY and set the Session date to October 6, 2025.
Below the ticker box, you can see the price and gain/loss of the selected ticker, along with the last updated time.
Timeframe and Historical Data
From the toolbar you can select 5m , 1hr , or 1d as your Timeframe , depending on your preference and trading style.
To view a past session there's no separate "Historical" button in v2 — just set the Session date in the top-left selector (or load a date directly with the URL app.bigshort.com/chart/<SYMBOL>/<YYYYMMDD>), and the chart shows that day's data. You can also use the Hours toggle to include or exclude pre- and post-market, and the % and OR toolbar controls to overlay percentile-threshold lines and opening-range shades.
Indicator Values Readout
BigShort v2 replaces the old top-right radial gauges with a draggable, resizable Indicator Values readout panel. Click the Indicator values button in the toolbar to open it, then drag it anywhere on the chart (grab a corner to resize). It surfaces the current live values for the indicators you have enabled — for example FastFlow, MomoFlow, GEX, and Skew.
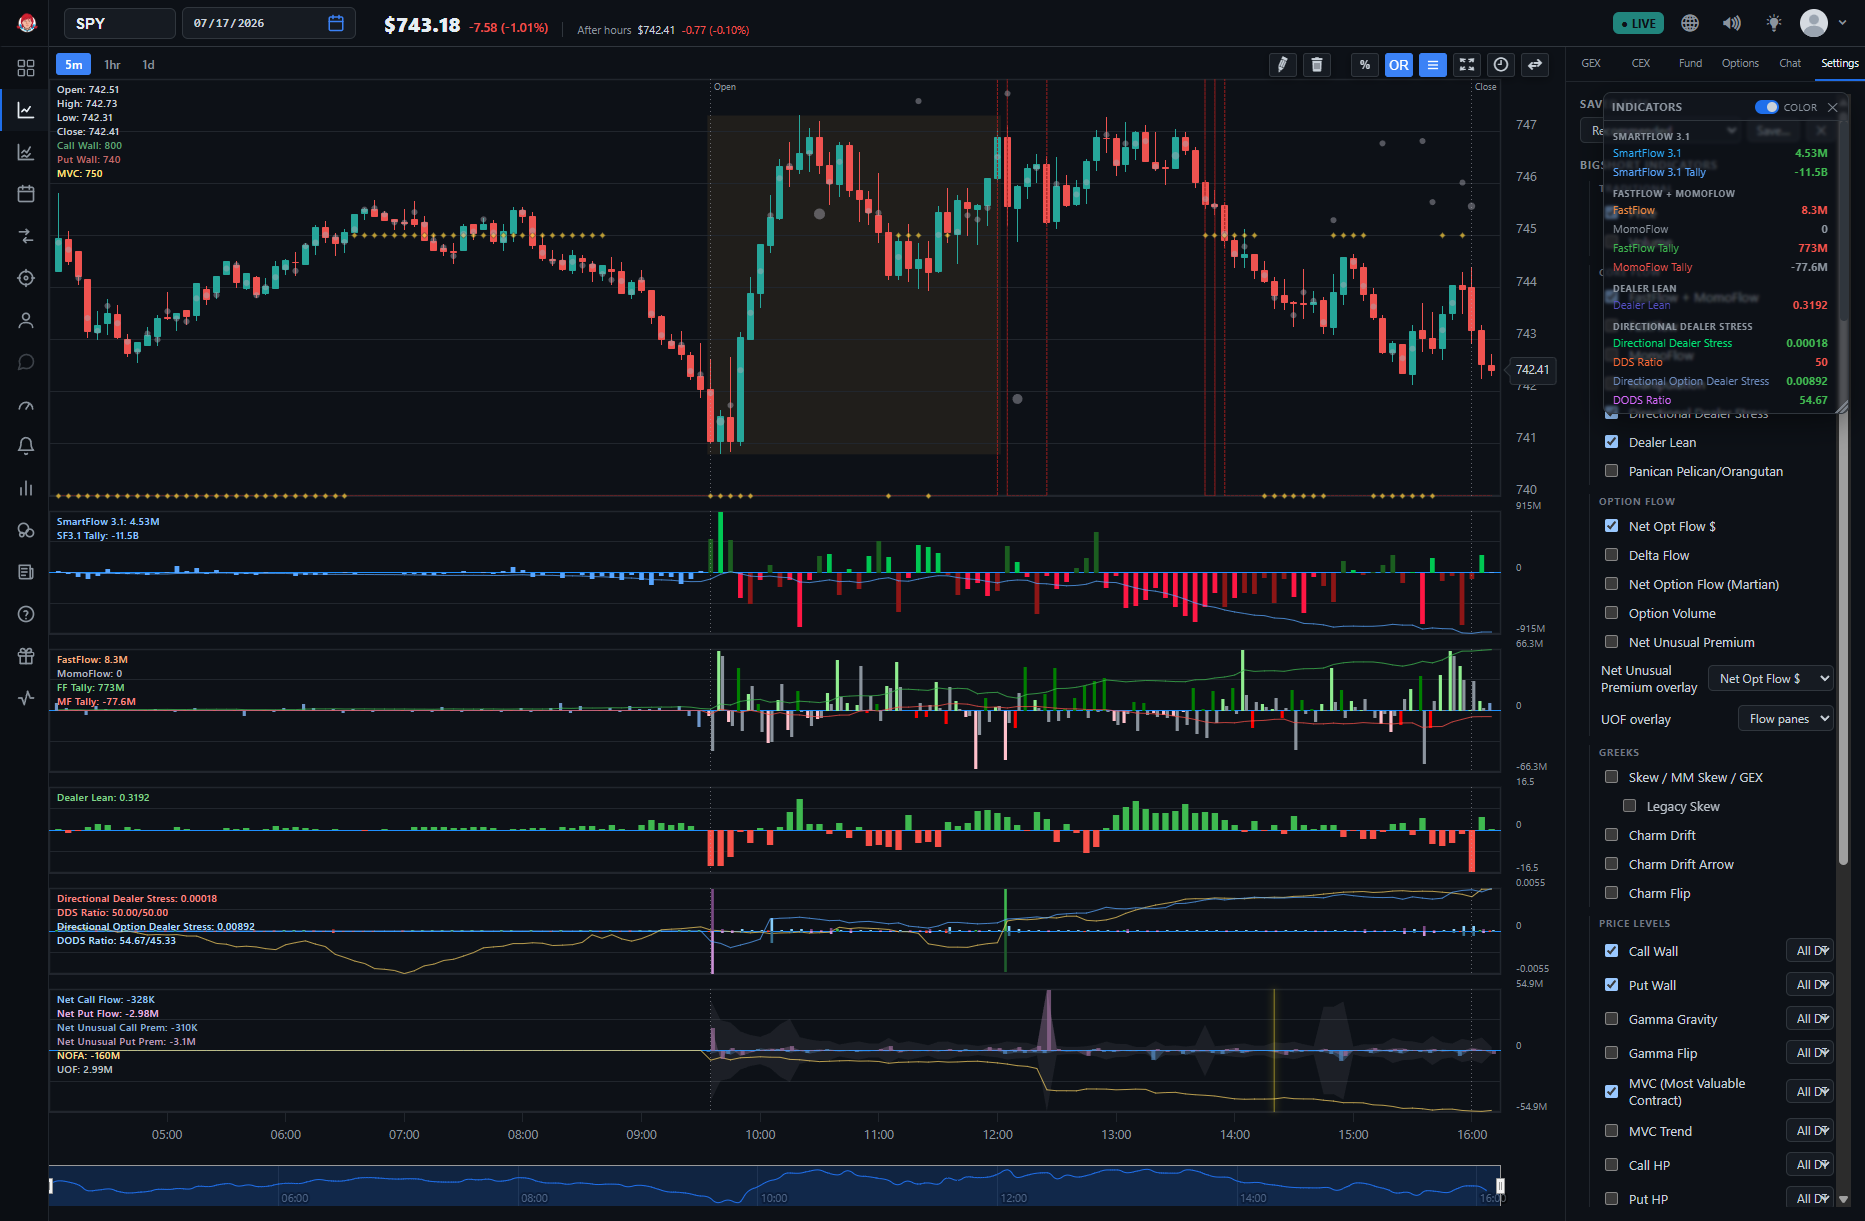
FastFlow & MomoFlow
FastFlow and MomoFlow are enabled under ⚙️ Settings → Core Flow, and are switched on together in the Recommended saved set — leave them both on and watch how they diverge, since that split often shows up right before a big move. You can see the combined pane in the chart overview above.
Full guide: FastFlow and MomoFlow — what each one measures, the color/alignment convention, and exhaustion reads.
Net Option Flow
Net Option Flow is an Option Flow indicator on the chart, enabled under ⚙️ Settings → Option Flow. Don't confuse it with the separate OptionFlow Tab, which is a scrollable table of individual option trades.
Full guide: Net Option Flow — how it separates buys from sells, weights them by dollar value, and reads NOFA.
Customize BigShort Indicator Visibility
You can turn each indicator on or off in the “Settings” panel to add or remove price chart indicators and sub-chart indicators under the price chart.
Options Side Panel
The right-hand Options tab shows full option-flow details for the current ticker — the same individual-trade detail you'd find on the OptionFlow tab, docked right next to your chart.
Hover Readout
Hovering over a bar updates the Indicator Values panel (and the GEX / CEX side panels) with that bar's numbers, so you can quickly see a full summary of trading flows and key metrics at any point on the chart.
⚙️ Settings & Saved Sets
⚙️ Settings is where you turn indicators on and off and customize how your charts look and respond. Open it from the toolbar and you'll find every indicator organized under the BIGSHORT INDICATORS heading in eight groups — Traditional, Core Flow, Option Flow, Greeks, Price Levels, BigShort Elite Indicators, Lame Lagging Indicators, and Controls (live update rate, trendline color). For the group-by-group breakdown of which indicators live where and where to learn each, see The Main Chart.
At the top of the panel is the Saved Sets block. Pick a saved layout from the combobox, or Save… your own. BigShort ships with a built-in Recommended set (it can't be deleted) that restores a sensible group of indicators and their on-chart order. To see what each option does, hover over its info icon.
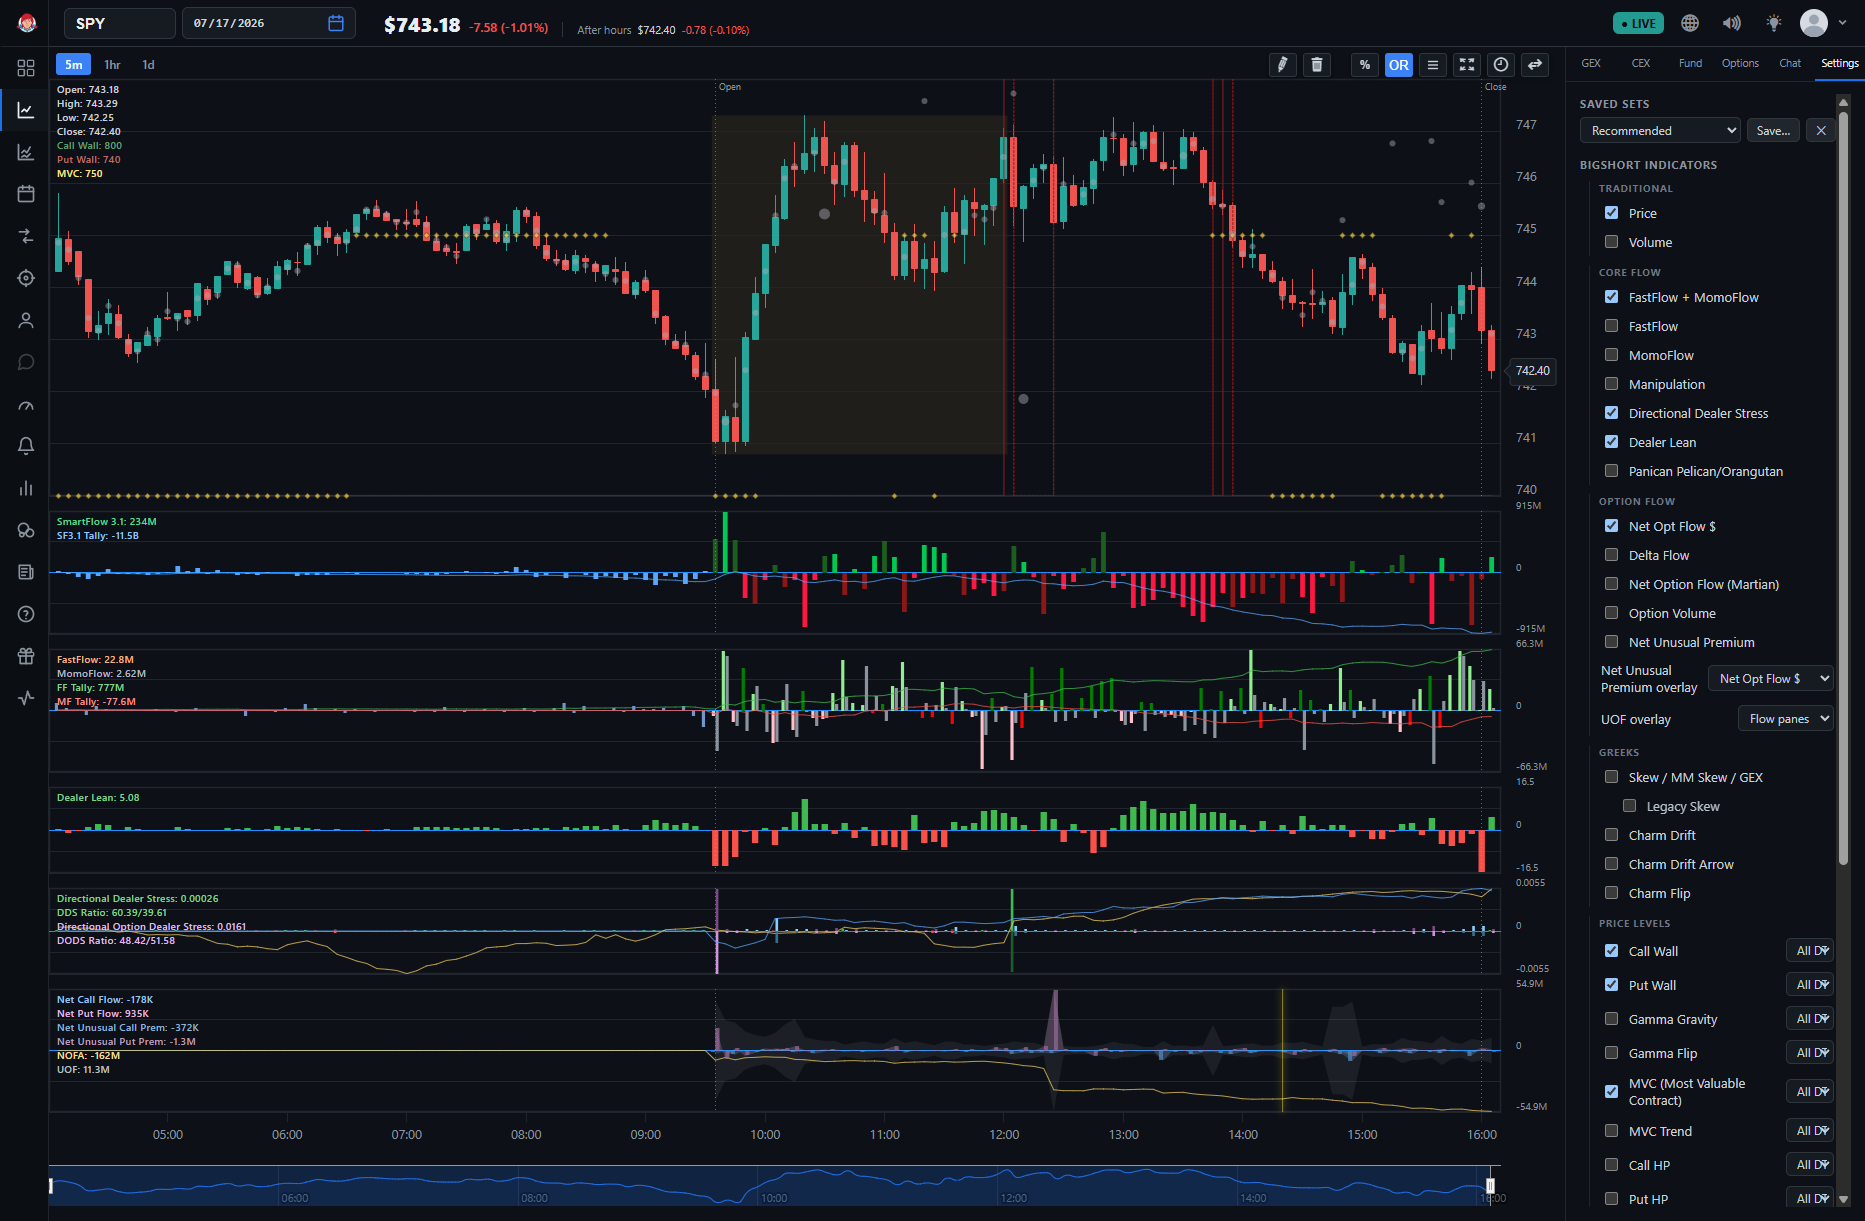
Tip for New Users:
Just use the Recommended saved set until you fully understand the nuances of every indicator.
Draw Trendline / Erase Trendlines
The Draw trendline toolbar button lets you place lines on the chart: click two points to draw, click again to stop, and double-click a line to remove it. Erase all trendlines clears them in one go, and you can set the trendline color under ⚙️ Settings → Controls.
It's useful for marking trends, support and resistance levels, or any custom reference points.
Restore Chart View button
Puts the navigation slider zoom back to its default settings.
Y: Fit Candles
This toggle ensures that only the OHLC candlesticks resize the pane, instead of the indicators that extend beyond the range — so the price action stays readable.
Full Screen button
The Full Screen toggle expands the chart to fill your entire screen, hiding menus and toolbars so you can focus fully on the chart or data view.
The heart of it all is the single Chart at app.bigshort.com/chart/SPY — every indicator is a toggle away under ⚙️ Settings. Click through it, try the Recommended saved set, and get a feel for the layout before moving on.
Account & Preferences
Account Menu
In the upper-right corner you'll find the header controls: Language, a Sound effects toggle, the Light / dark mode toggle, and your Account menu. Opening the Account menu shows Customer portal , View forms , Link providers , Referrals , Members Discord , and Log out.
Customer Portal
Here you can view or upgrade your current subscription.
Chat & Discord
There's no standalone Discord button on the chart. Live Chat is a tab in the right-hand side panel, and the link to the Members Discord community lives in your Account menu.
Alerts
BigShort doesn't use a single "alert" button. Audio alerts are controlled by the Sound effects toggle in the header — these can notify you about key market events like power hour, unusual options activity, golden sweeps, dark pool trades, and possible market manipulation. For custom, symbol-specific alerts, use the Spodin tab.
Light / Dark Mode
Toggle between Dark Mode and Light Mode from the header.
Dark Mode
Light Mode
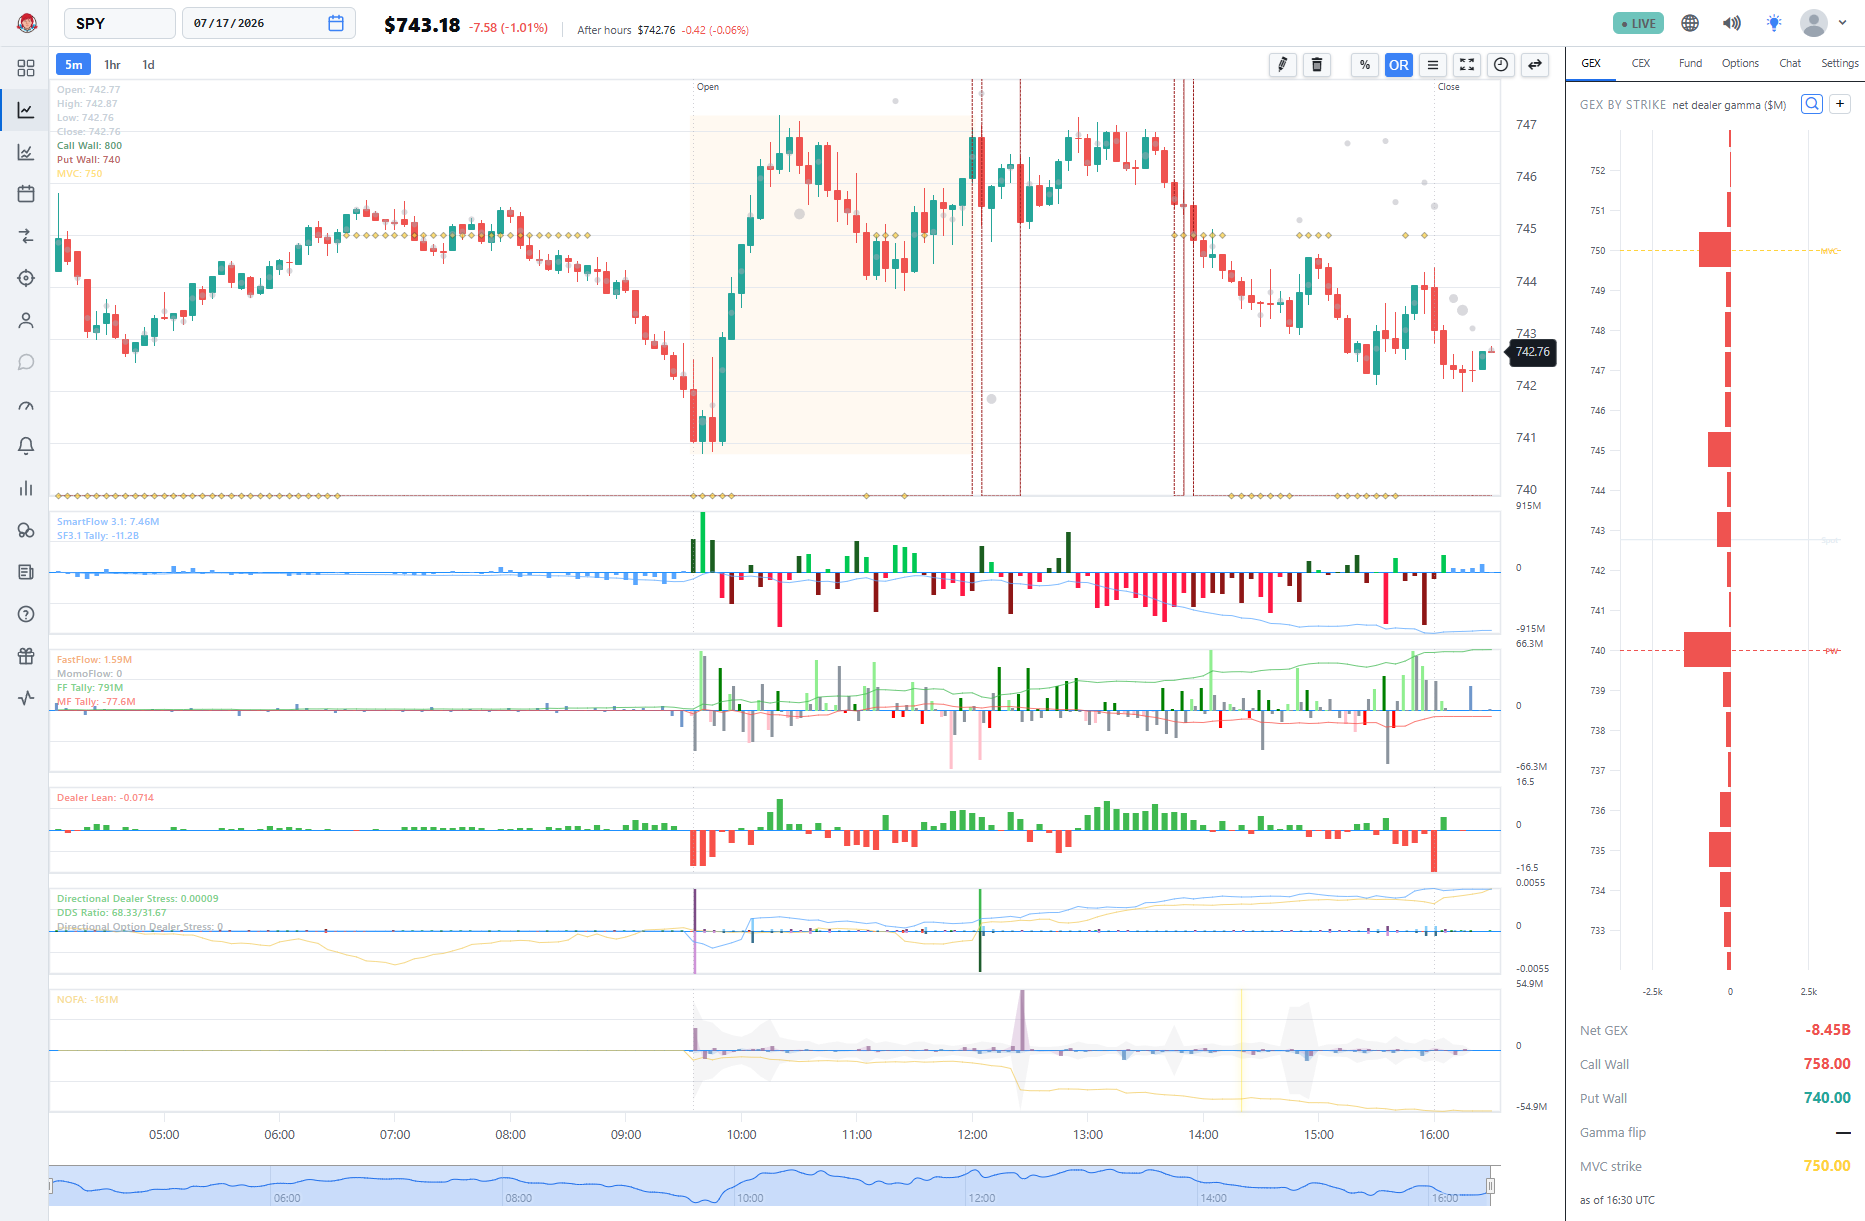
Feel free to choose the mode that best fits your trading environment — whether Dark Mode or Light Mode.
Next Step
Now that you know where each pane and control lives, see BigShort Indicators & Key Concepts for how each indicator works and how they rank in importance relative to each other.