📅 Seasonality Tab
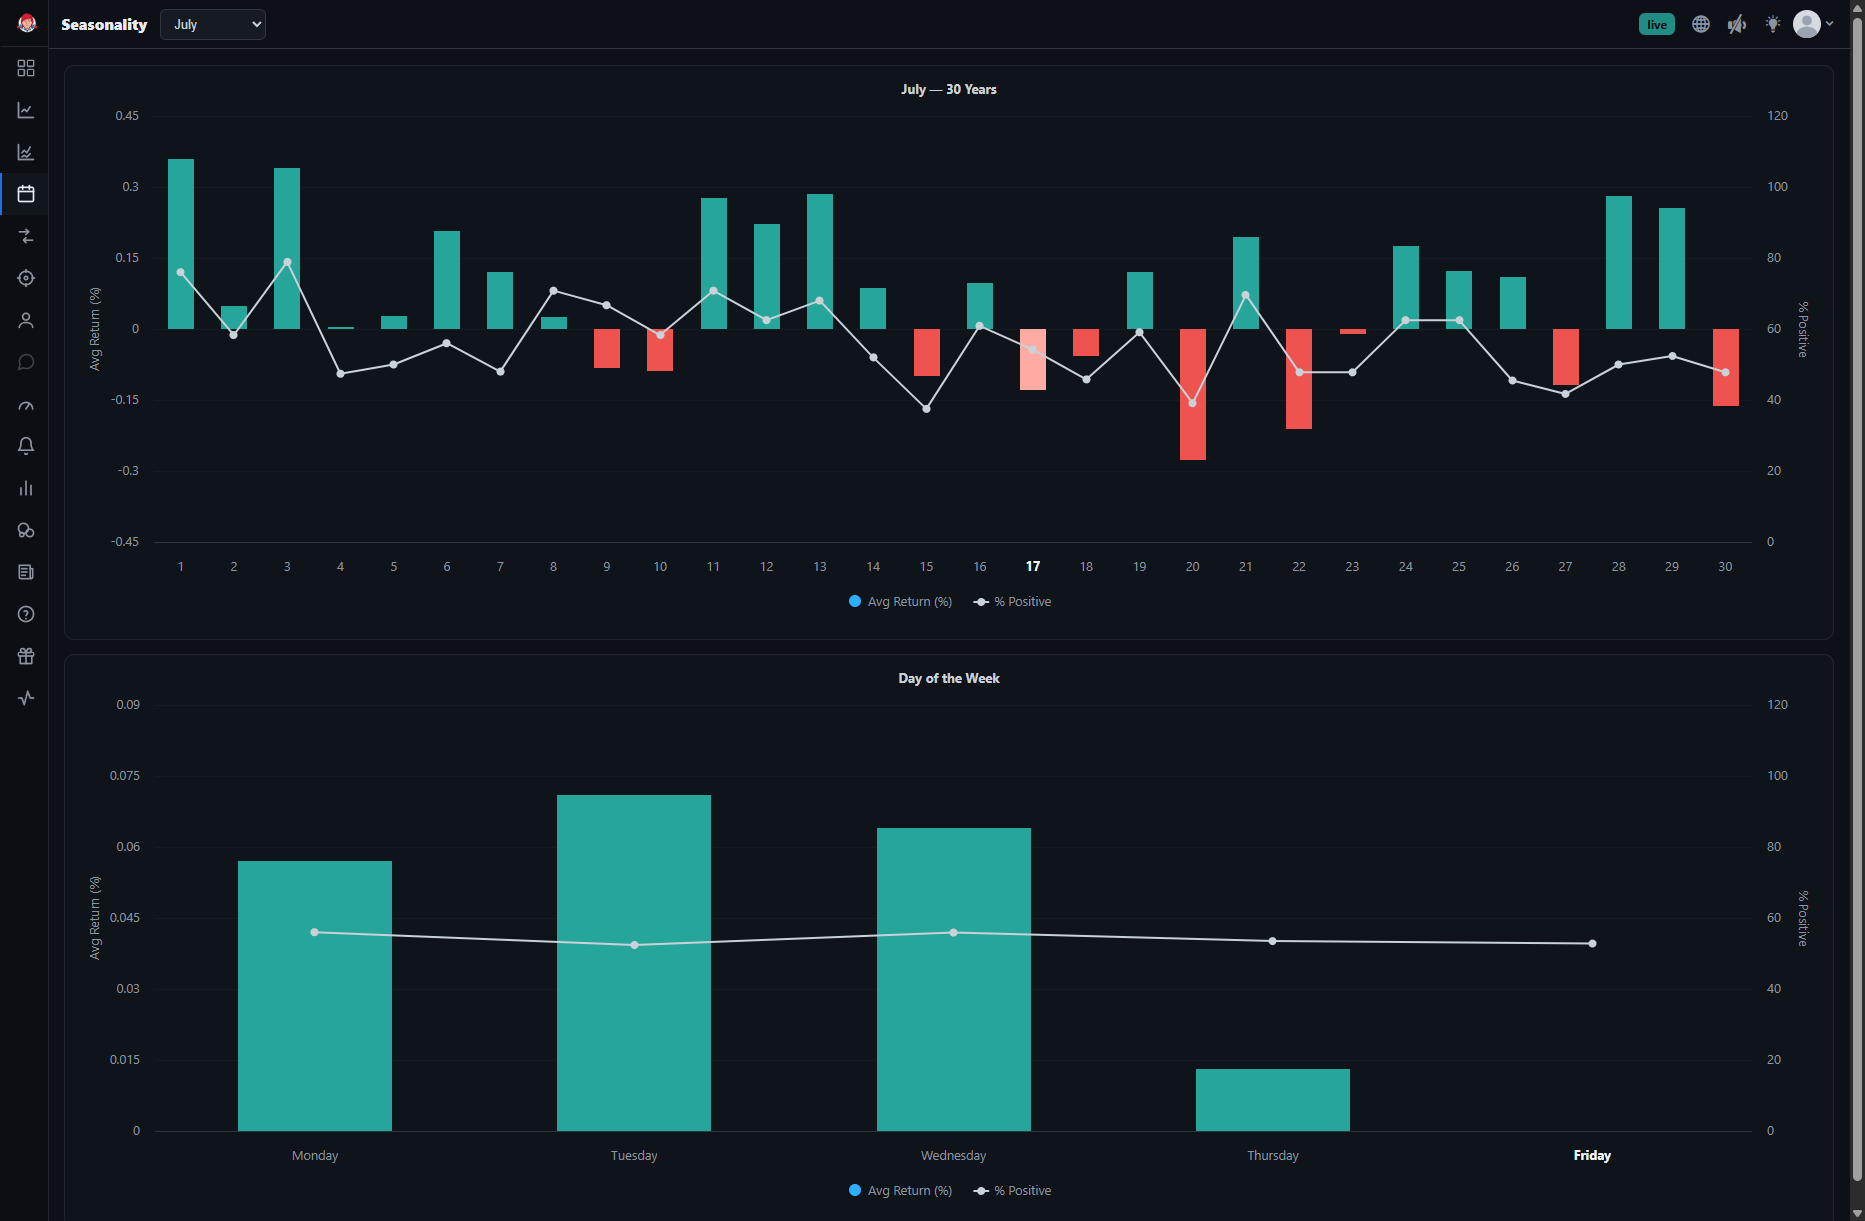
The Seasonality tab (app.bigshort.com/seasonality.html, nav Seasonality) provides a unique perspective on the historical performance of SPY, broken down by calendar date and day of the week. Use the month selector (January–December) at the top of the tab to focus on a specific month. This tool helps traders identify patterns and trends that have occurred consistently over the past 30 years, offering insights that can add an extra layer to your trading strategy.
What Does the Seasonality Tab Show?
-
Calendar Date Performance ("[Month] — 30 Years") :
-
The top chart, titled for the month you select (for example, March — 30 Years), displays SPY's average performance for each calendar day of that month over a 30-year lookback.
-
Key metrics include:
-
Average Return : The average price change for SPY on that specific date.
-
Percent Positive : The percentage of years SPY closed higher on that date.
-
-
-
Day of the Week Performance :
-
The bottom chart, titled Day of the Week, summarizes the historical performance of SPY based on the day of the week (Monday through Friday).
-
Metrics include:
-
Average Return : How SPY has historically performed on each day of the week.
-
Percent Positive : The likelihood of SPY closing higher on each weekday.
-
-
How to Use the Seasonality Tab
-
Pre-Market Planning :
-
Before the trading day starts (or even the day prior), use the Seasonality tab to gain a directional bias for the day.
-
For example, November 24th is historically one of the most bullish trading days of the year, with:
-
83% Positive Close : SPY has closed higher 83% of the time on this date.
-
+0.73% Average Return : SPY has averaged a 0.73% increase on this date historically.
-
-
-
Adding Context to Your Trades :
-
Seasonality is a weaker force in the market compared to real-time indicators, but it can help frame your strategy.
-
Use it as an additional layer of analysis alongside tools like FastFlow, Dark Pools, and other proprietary BigShort indicators.
-
Pro Tips for Using Seasonality
-
Look for Confluence : Combine seasonality trends with other market indicators to build a stronger case for your trades.
-
Identify Key Dates : Use the calendar date performance chart to spot historically bullish or bearish days.
-
Weekday Patterns : Use the day-of-week chart to identify recurring trends, such as whether Mondays or Fridays tend to perform better or worse.