📊 Short Volume Tab
The Short Volume tab (app.bigshort.com/shortvolume, nav Short Volume) breaks down a symbol's daily trading into its short-selling components, so you can see how much of the volume is short, how much is genuinely new activity, and how much is flagged short-exempt. Because the tab carries history back to 2010, you can study these patterns over long stretches rather than just the current session.
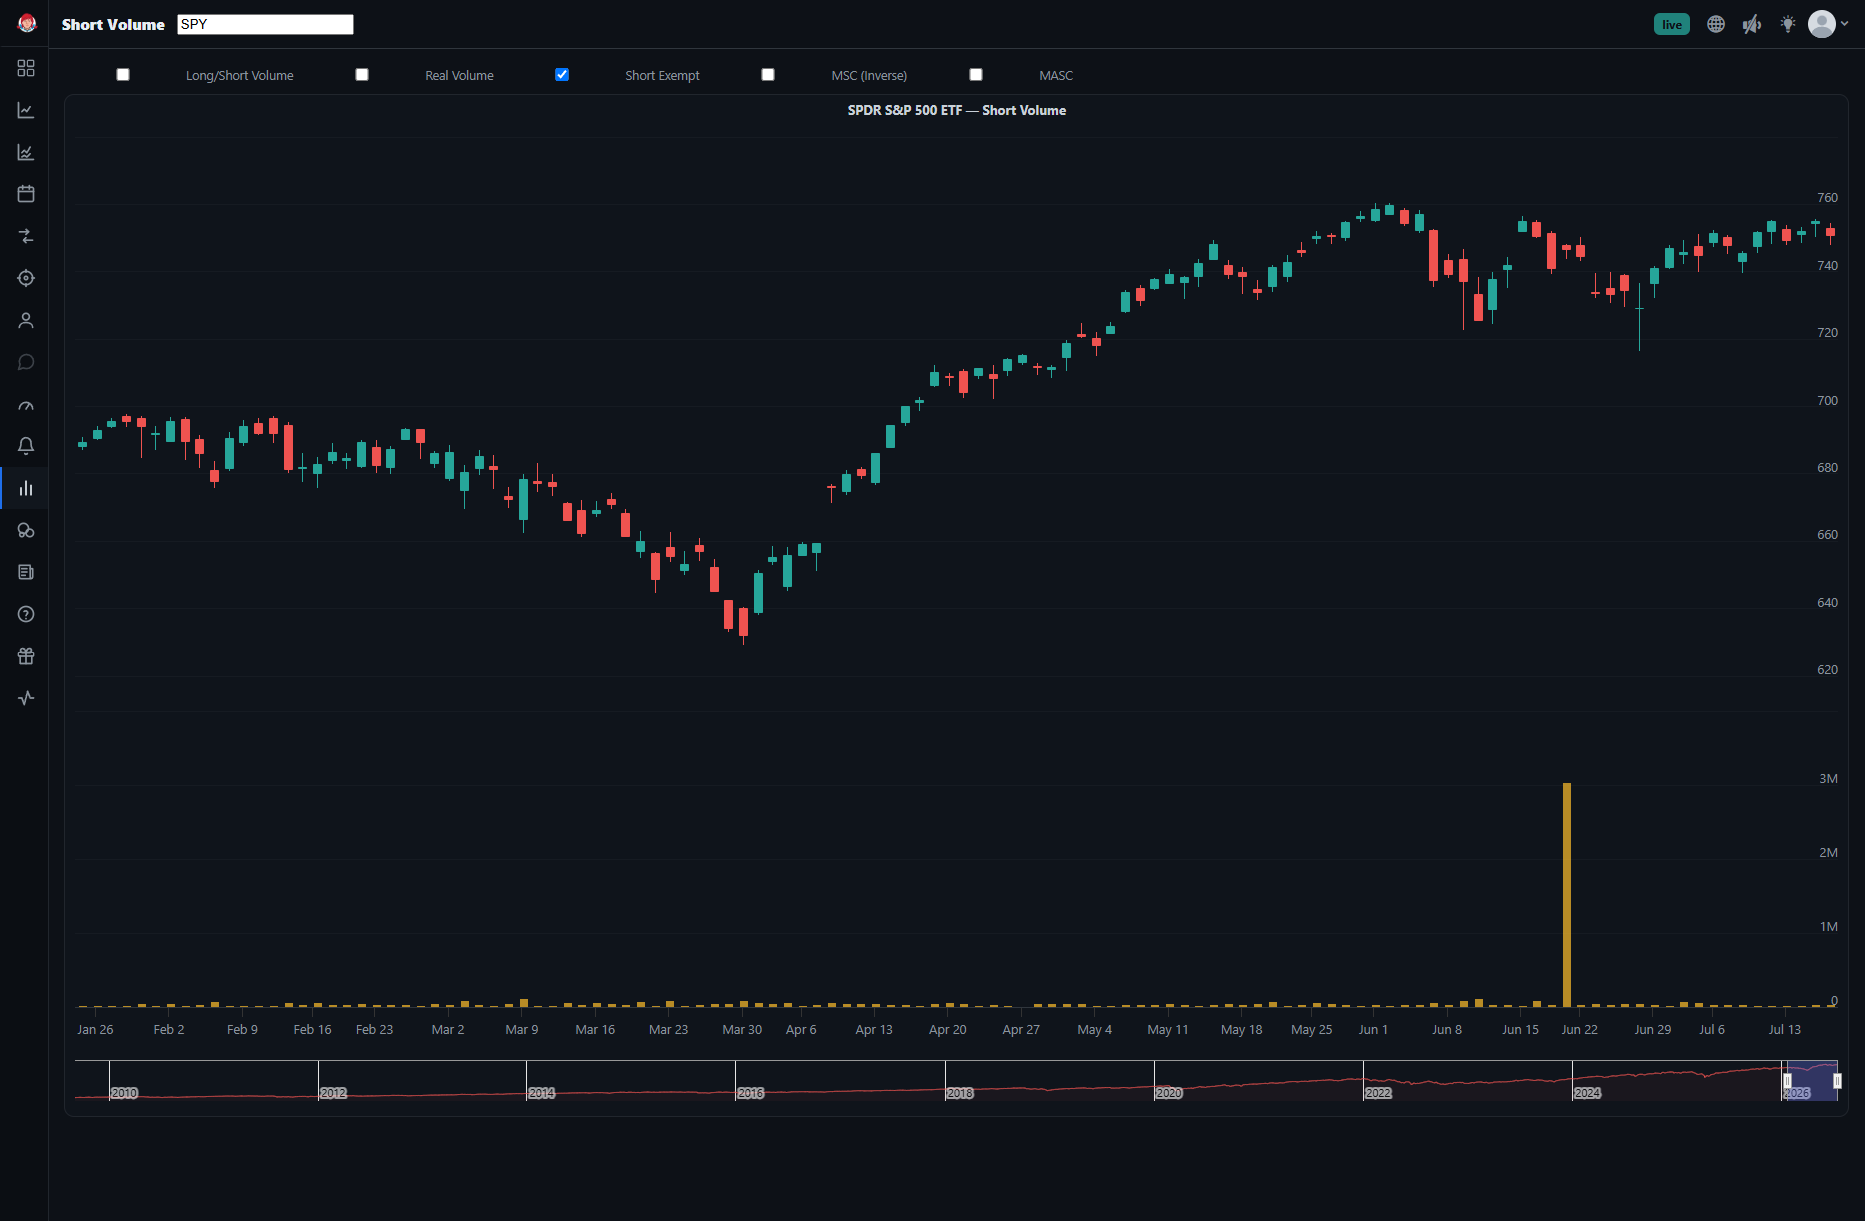
The Views
A view selector lets you switch between five different cuts of the data:
- Long / Short Volume — the split between long and short volume, the baseline read on how much of a name's activity is short-driven.
- Real Volume — a real-volume view of the tape.
- Short Exempt — isolates short-exempt volume (see below).
- MSC (Inverse) — reflects the minimum number of short shares that roll over into the next day. When MSC is elevated, it suggests that shorts are holding their shares rather than covering, which typically leans bearish but sometimes it creates conditions for a short squeeze.
- MASC — accumulation of MSC over time.
About Short-Exempt Volume
Short-exempt trades are short sales that are exempt from the standard uptick/short-sale restrictions — most come from market makers — and unusual spikes can be a meaningful signal. BigShort documents this in depth in its own article:
- Understanding Short Exempt — what short-exempt volume is and why it matters.
The same short-exempt signal also drives two of the Dashboard's Top 10 lists — Short Exempt and Short Exempt +10 Day — so you can jump from a name flagged there straight into this tab for the full history.
How to Use the Short Volume Tab
- Gauge the short pressure: start with Long / Short Volume to see how much of a name's activity is short-driven.
- Compare the views: switch between Real Volume, MSC (Inverse), and MASC for different cuts of the same data.
- Hunt short-exempt spikes: use the Short Exempt view to spot unusual short-exempt activity, then read Understanding Short Exempt for how to interpret it.
- Study the history: because the data reaches back to 2010, compare today's readings against how the same name behaved in past regimes.
- Understanding Short Exempt — the short-exempt signal in depth
- Understanding the Dashboard's Top 10 Lists — where short-exempt names are surfaced