Tae's Corner: SPY - Sept. 20, 2024
In Tae's corner, we share small snap shots of advice and wisdom from BigShort's founder, Tae, that he often shares in the Tutoring channel of our Discord community.
The setup discussed below is SPY on the FastFlow tab of BigShort's v1 interface (in today's app: the main chart with FastFlow enabled) and was shared on the Discord on September 20th 2024.
The screenshots below were captured in BigShort's v1 interface; the setup and mechanics they show are unchanged in today's app.
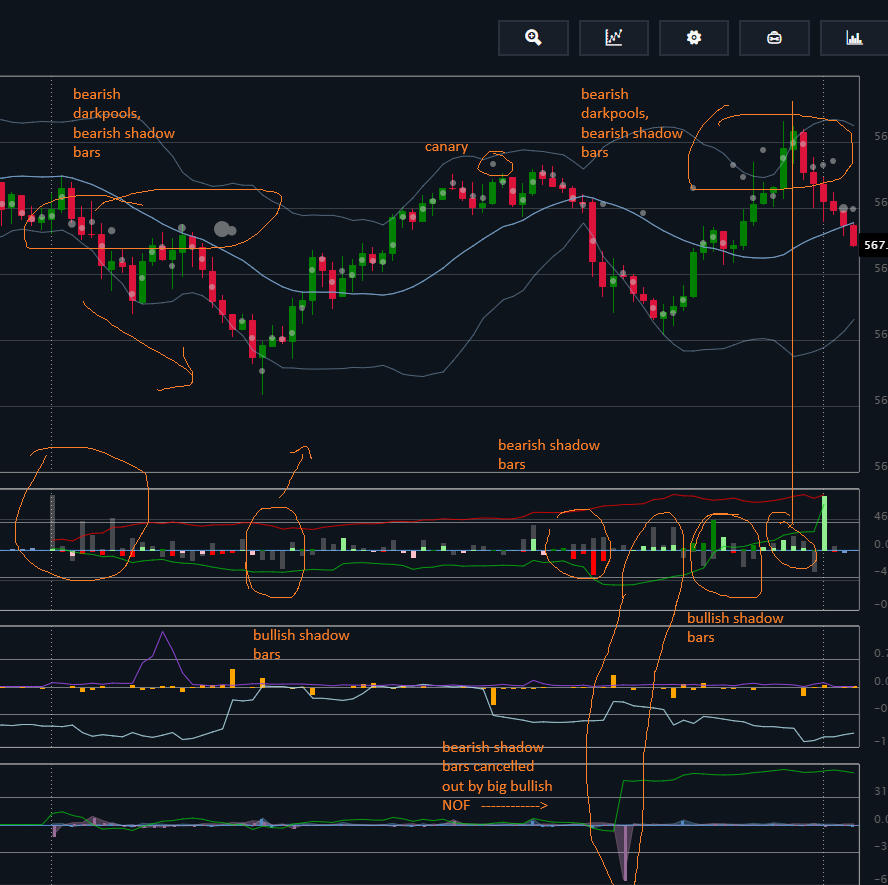
This is a busy day, full of insights, so let's break them down into less-daunting, clearer chunks, for analysis.
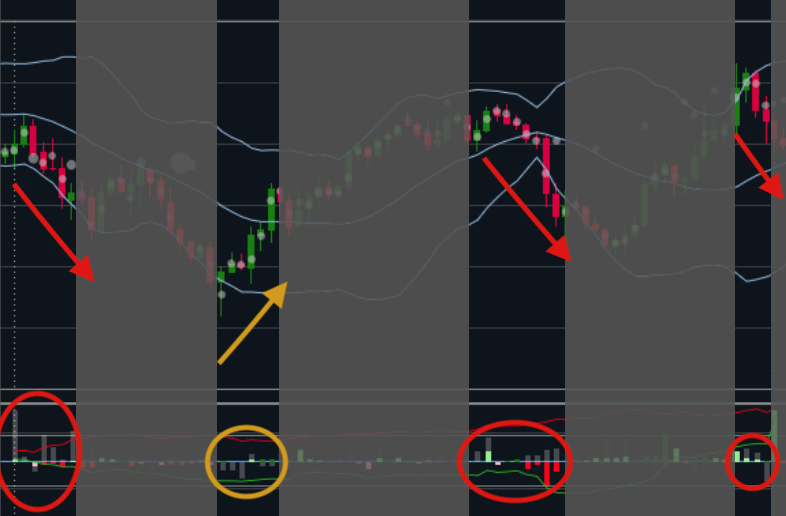
Momo "Shadow" Bars Were Predictive: Below, we've isolated just the Shadow Bars and the price impact so it's easier to see. As you can see, there were four main times where Shadow Bars were predictive. Three were bearish (red ovals, below) and one was bullish (yellow oval, below)
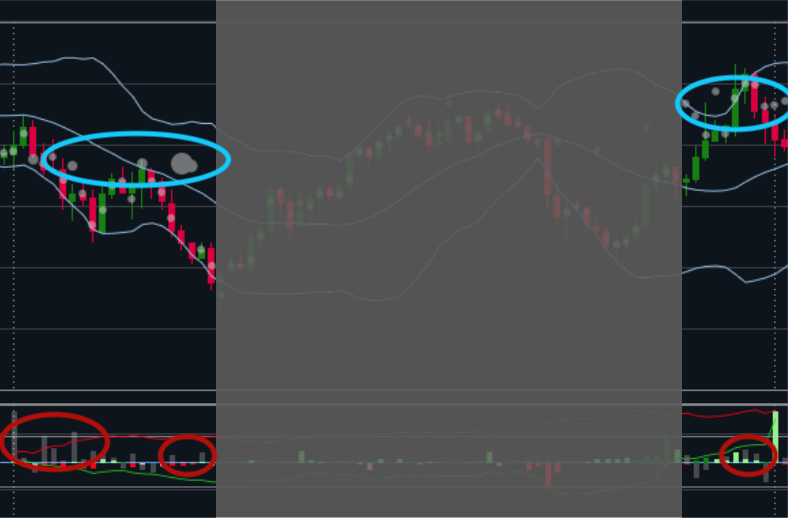
Even More Predictive Combined with Dark Pools : When you add the Dark Pool action to our isolated image, its gets even clearer how predictive BigShort's indicators are. Note how the Dark Pools (below, blue ovals) add more information and confidence to the short positions, in some cases giving even more advanced warning or connecting a longer trade.
Counter Signals Cancel Out : At BigShort we always recommend looking for agreement or "confluence" among signals. Here's an example of why that matters.
Note how the obvious bearish shadow bars (red oval, below) were preceded by a giant bullish Net Options Flow put-selling pyramid (purple oval, below).
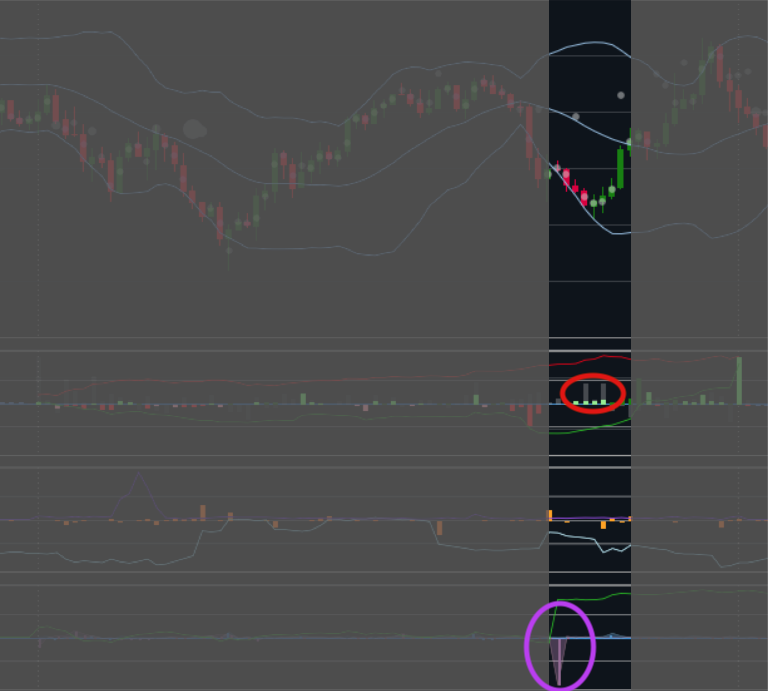
Having just seen an outsized bullish signal moments before, these bearish shadow bars were less trustworthy and, as you can see, didn't lead to downward price movement. Waiting for agreement among multiple indicators increases trading consistency and profitability.
Stay Tuned for More From Tae: As you see outlined above, Tae's play-by-plays in the BigShort Discord community help new and experienced BigShort traders alike understand how to read the institutional flows to increase profit and avoid loss.
We encourage all traders to lurk (or participate!) in the Discord to increase your skills at the fastest possible rate and build consistency in your trading with BigShort institutional insights data.