Head and Shoulders Patterns with BigShort
Head and Shoulders is one of the oldest reversal patterns in technical analysis, and one of the most misread — a neckline break gets traded constantly by chart-watchers even when nothing behind it supports a real reversal. Below is how to spot the pattern, and how to use Net Options Flow (NOF), DarkPools, and BigShort's other institution-following signals to tell a genuine reversal from one that's likely to fail.
What Is a Head and Shoulders Pattern?
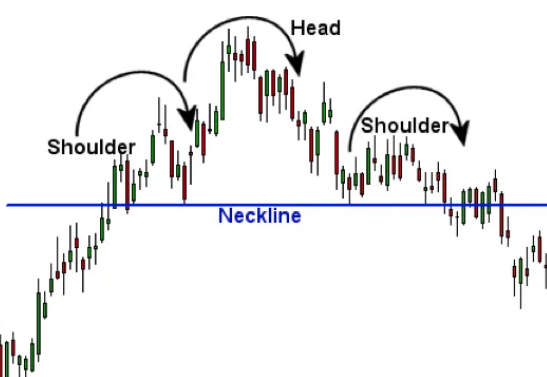
The Head and Shoulders pattern is a powerful chart formation signaling a potential reversal of an uptrend into a downtrend. It consists of three peaks: the first and third (the "shoulders") are lower than the central peak (the "head"), and they are connected by a "neckline" that acts as support. When the price breaks below the neckline, it often indicates the start of a downtrend.
You can also encounter an Inverse Head and Shoulders pattern, which signals a reversal of a downtrend into an uptrend. The same principles apply, but the peaks and directions of trade are inverted.
How to Identify the Pattern
To spot a Head and Shoulders pattern:
- Look for a clear uptrend leading into the formation.
- Identify the three peaks: the left shoulder, the head (highest point), and the right shoulder.
- Confirm the neckline, which connects the low points between the shoulders and the head.
- Use BigShort's institutional-tracking signals, such as Net Options Flow or Dark Pools, to confirm whether institutional and/or algorithmic players are aligning for a reversal.
BigShort's alerts flag both when a potential Head and Shoulders setup is playing out (turning bearish) and when it's been invalidated, so you're not left staring at the chart trying to guess whether the reversal is still live.
How to Trade the Pattern with BigShort
-
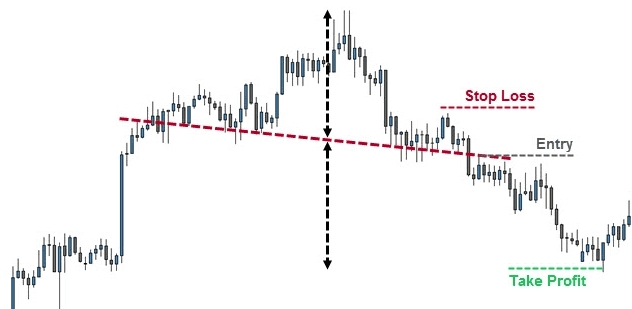
Entry Point: Wait for the price to break below the neckline (in the case of a regular pattern) or above it (for an inverse pattern). This breakout often comes with increased volume, which is a moderately strong confirmation of the move.
BigShort's data can show you whether the move is being driven by retail (momo) traders, institutional players, or both, and whether it's backed by large options trades and dark pool activity — which makes the entry easier to trust.
-
Check institutional alignment: For a traditional (bearish) Head and Shoulders pattern, look for bearish signals from institutional investors. BigShort makes these easy to spot:
Bearish Net Options Flow (NOF) Pyramids (purple pointing up, blue pointing down — the larger, the more bearish)
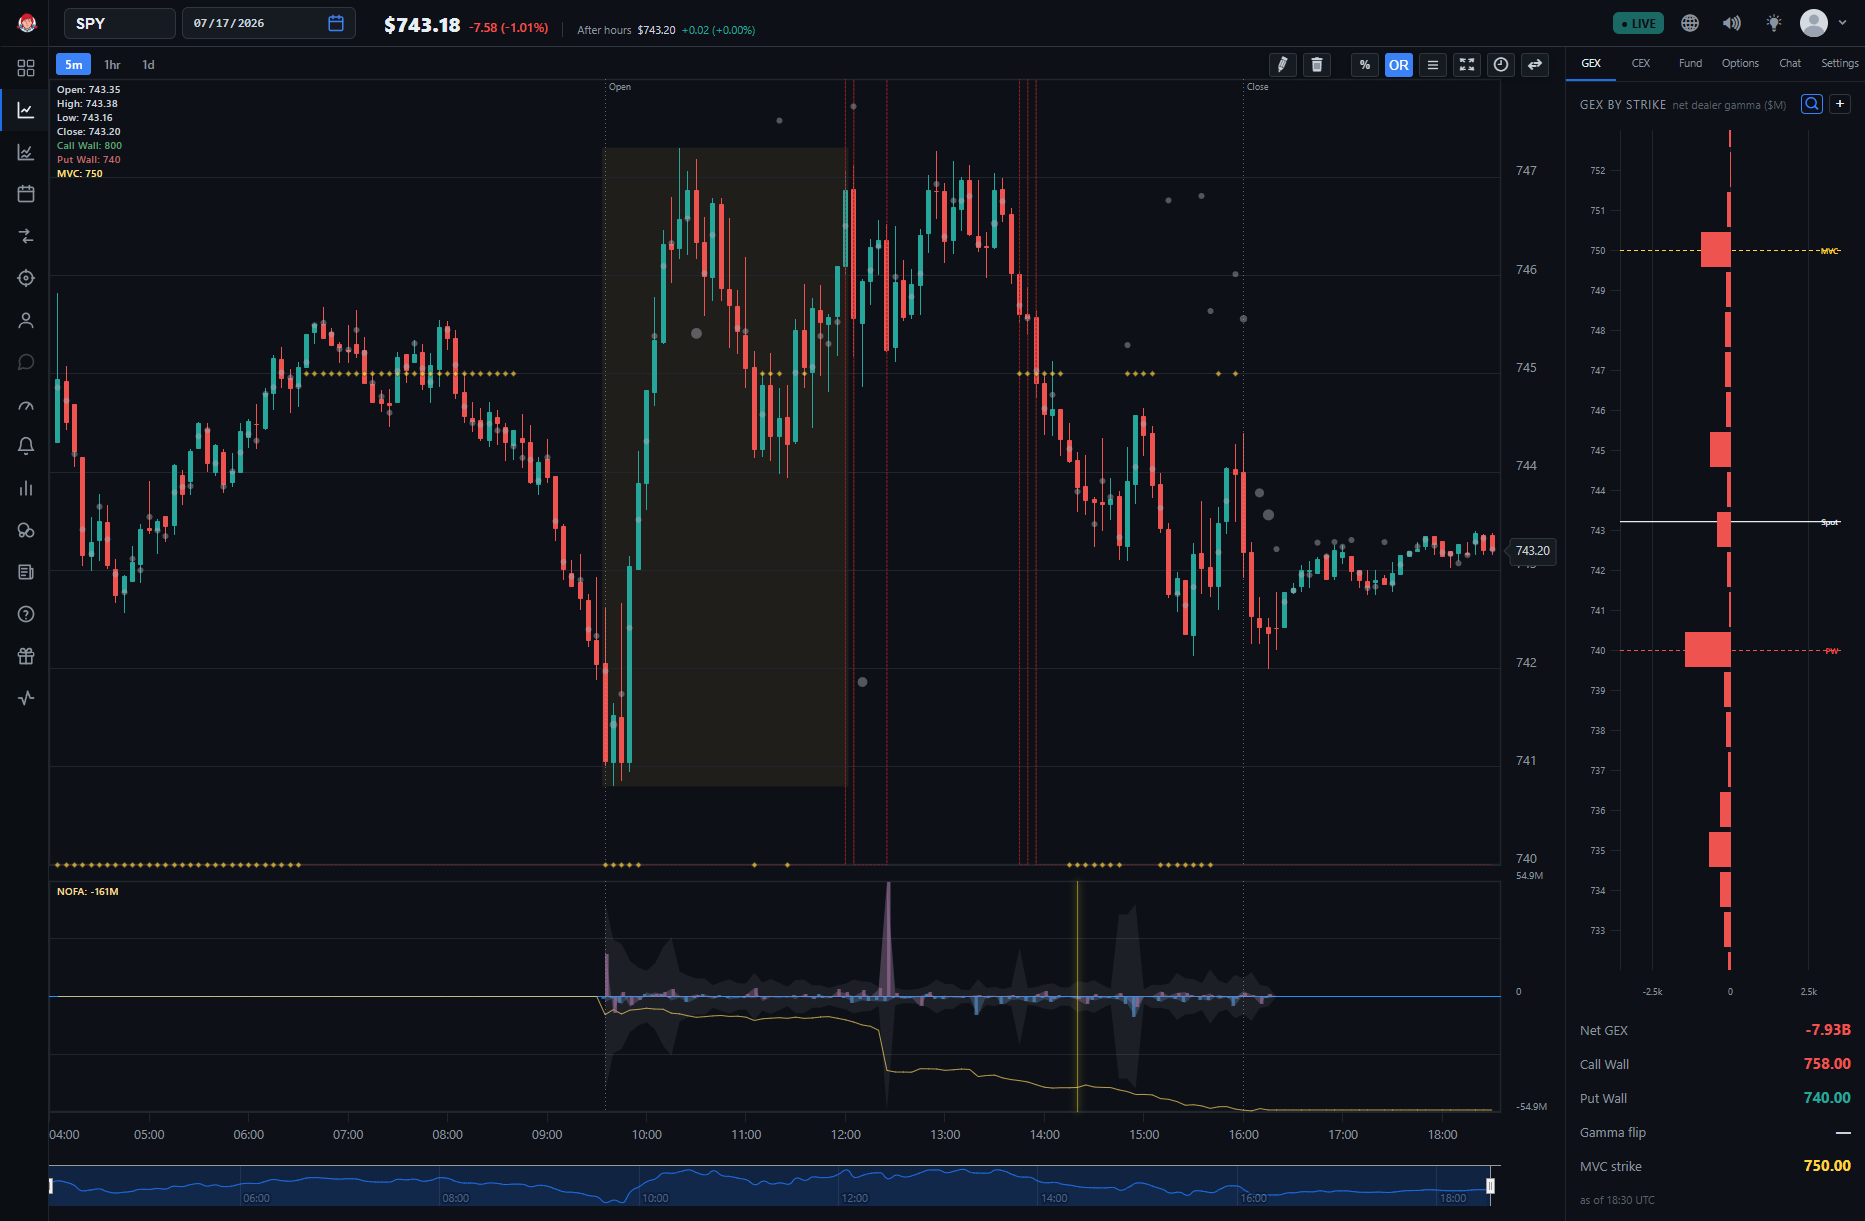
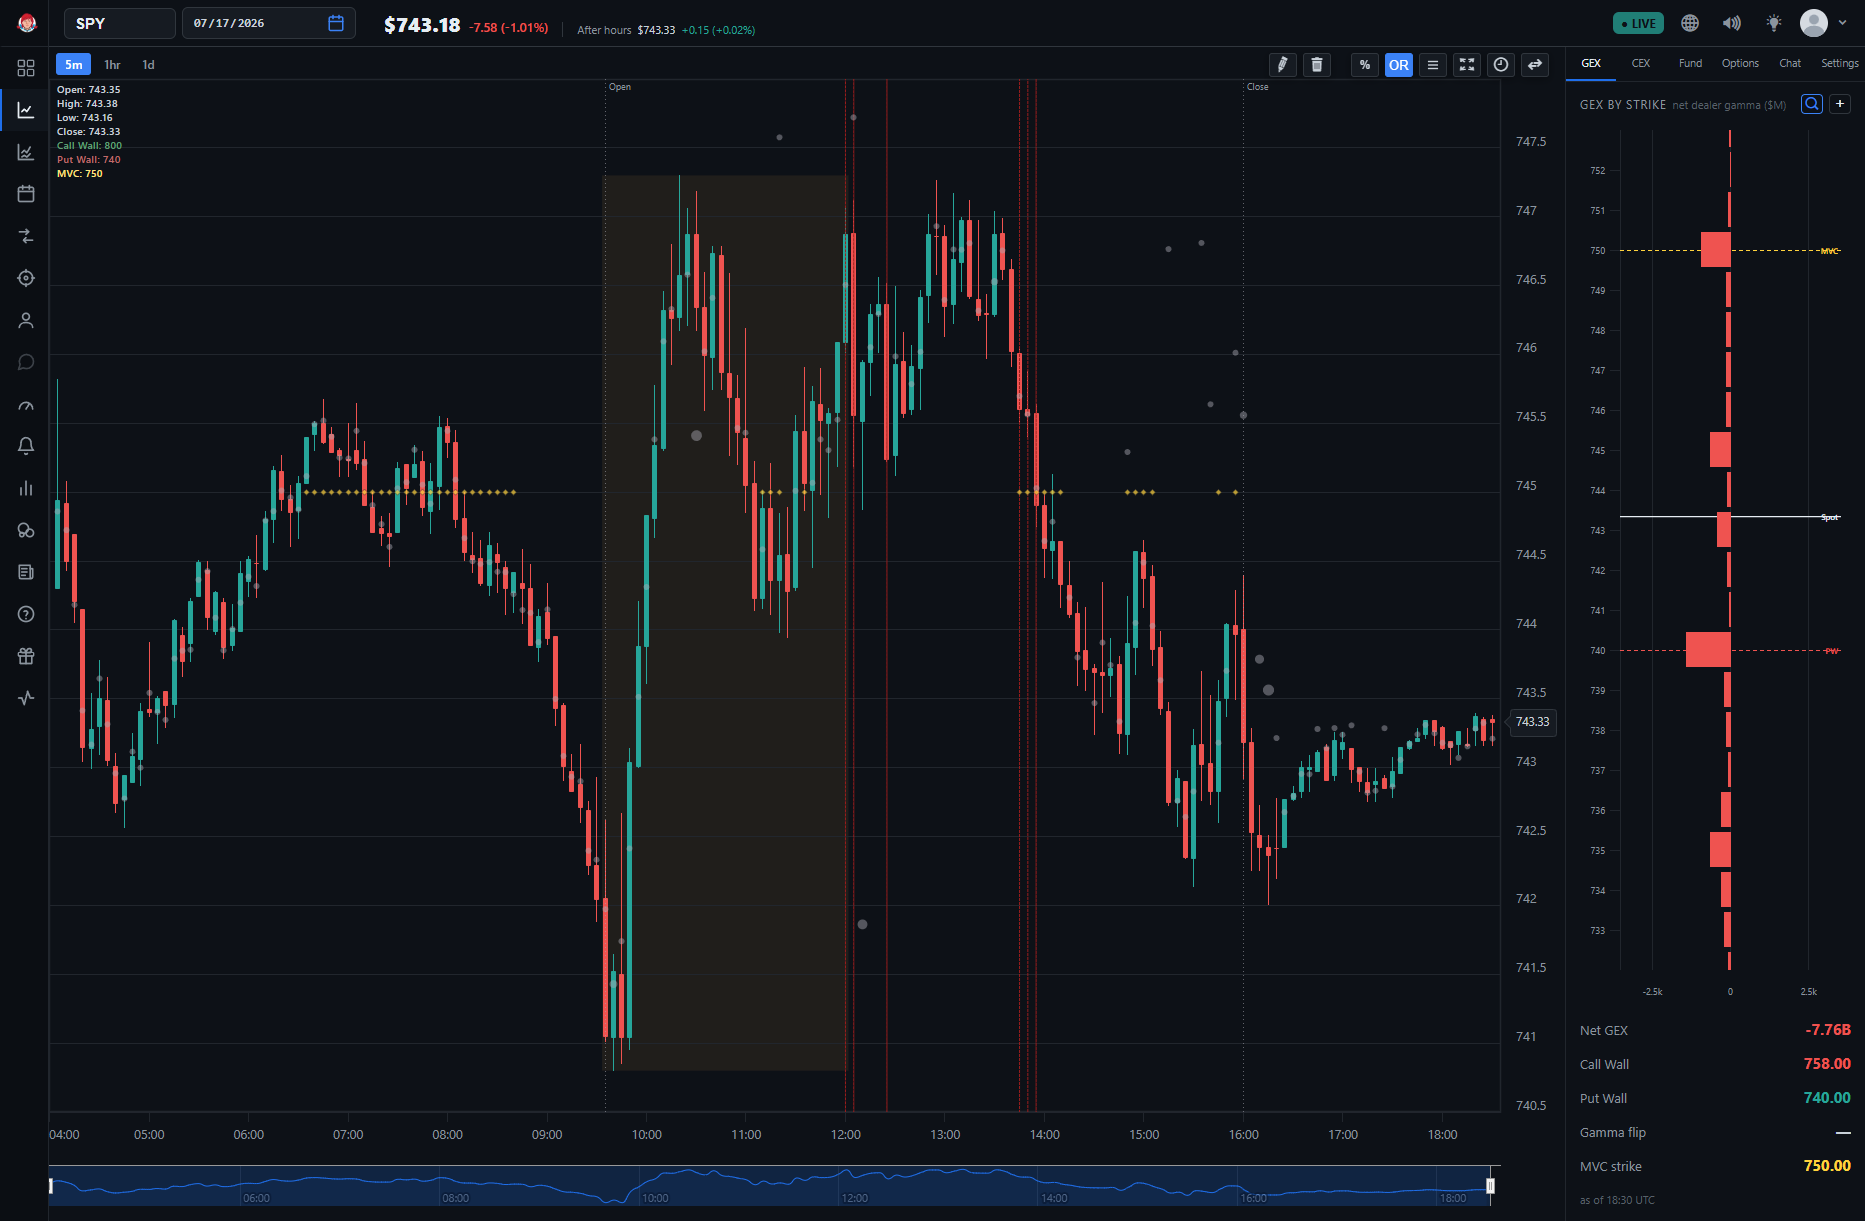
Bearish Dark Pools (grey circles above the price action — the larger and more numerous, the more bearish)
-
Stop-Loss Placement: Place your stop-loss just above the right shoulder for a standard Head and Shoulders pattern (or just below for an inverse). This protects your trade in case the pattern fails and the price reverses direction — which is far less likely to happen with the major players behind you.
-
Profit Target: Measure the height from the head to the neckline and project that distance downward (or upward for an inverse pattern) from the breakout point. This gives you a clear profit target, and BigShort's indicators help you judge it as you go: you can see whether market players are still moving in the new direction (worth staying in longer for) or whether it's time to get out.
Confirming the Reversal Is Real
Head and Shoulders is one of the most widely recognized patterns in retail trading, and that popularity is part of the risk: plenty of neckline breaks get bought or sold simply because chart-watchers expect them to, then snap back once that pressure runs out. NOF and Dark Pools earn their place in this setup by answering the question price alone can't — is the break backed by real institutional selling, or is it a retail-driven move likely to fail? That distinction is what separates a textbook pattern from one worth actually trading.
- Support Breakout Trades — another BigShort pattern strategy
- Ascending and Descending Triangles — triangle pattern trading
- Net Option Flow — for entry timing and confirmation