Support Breakout Trades with BigShort
Introduction
A support breakout trade isn't really about the breakout itself — it's about whether the support level holds in the first place. This guide covers how to read a support test using DarkPools, MomoFlow, and Net Option Flow (NOF), and how to size up early whether the level is likely to hold or fail.
What Is a Support Breakout Trade?
A support breakout trade occurs when the price tests a significant support level and then bounces higher rather than breaking down. In this scenario, the support level—established by previous price action—holds firm, signaling strong underlying demand. When the price reverses upward from this level, it indicates that buyers are stepping in, often leading to a traceable, sustained move higher.
How to Identify the Setup – Support Breakout
Draw the Support Line
Identify a key support level by marking previous lows where buyers stepped in. This level acts as a floor for price action.
Monitor the Price Action
Observe how the price behaves as it approaches support. A period of consolidation or a brief dip followed by a strong bullish candlestick can indicate that the support is holding.
Look for Bullish Candlestick Formations
A strong bullish candle (or a series of them) forming on or near support suggests that buyers are overpowering sellers. This is your first clue that a support breakout trade may be forming.
BigShort Provides Advanced Warning
BigShort's platform offers advanced insights that give you an edge:
-
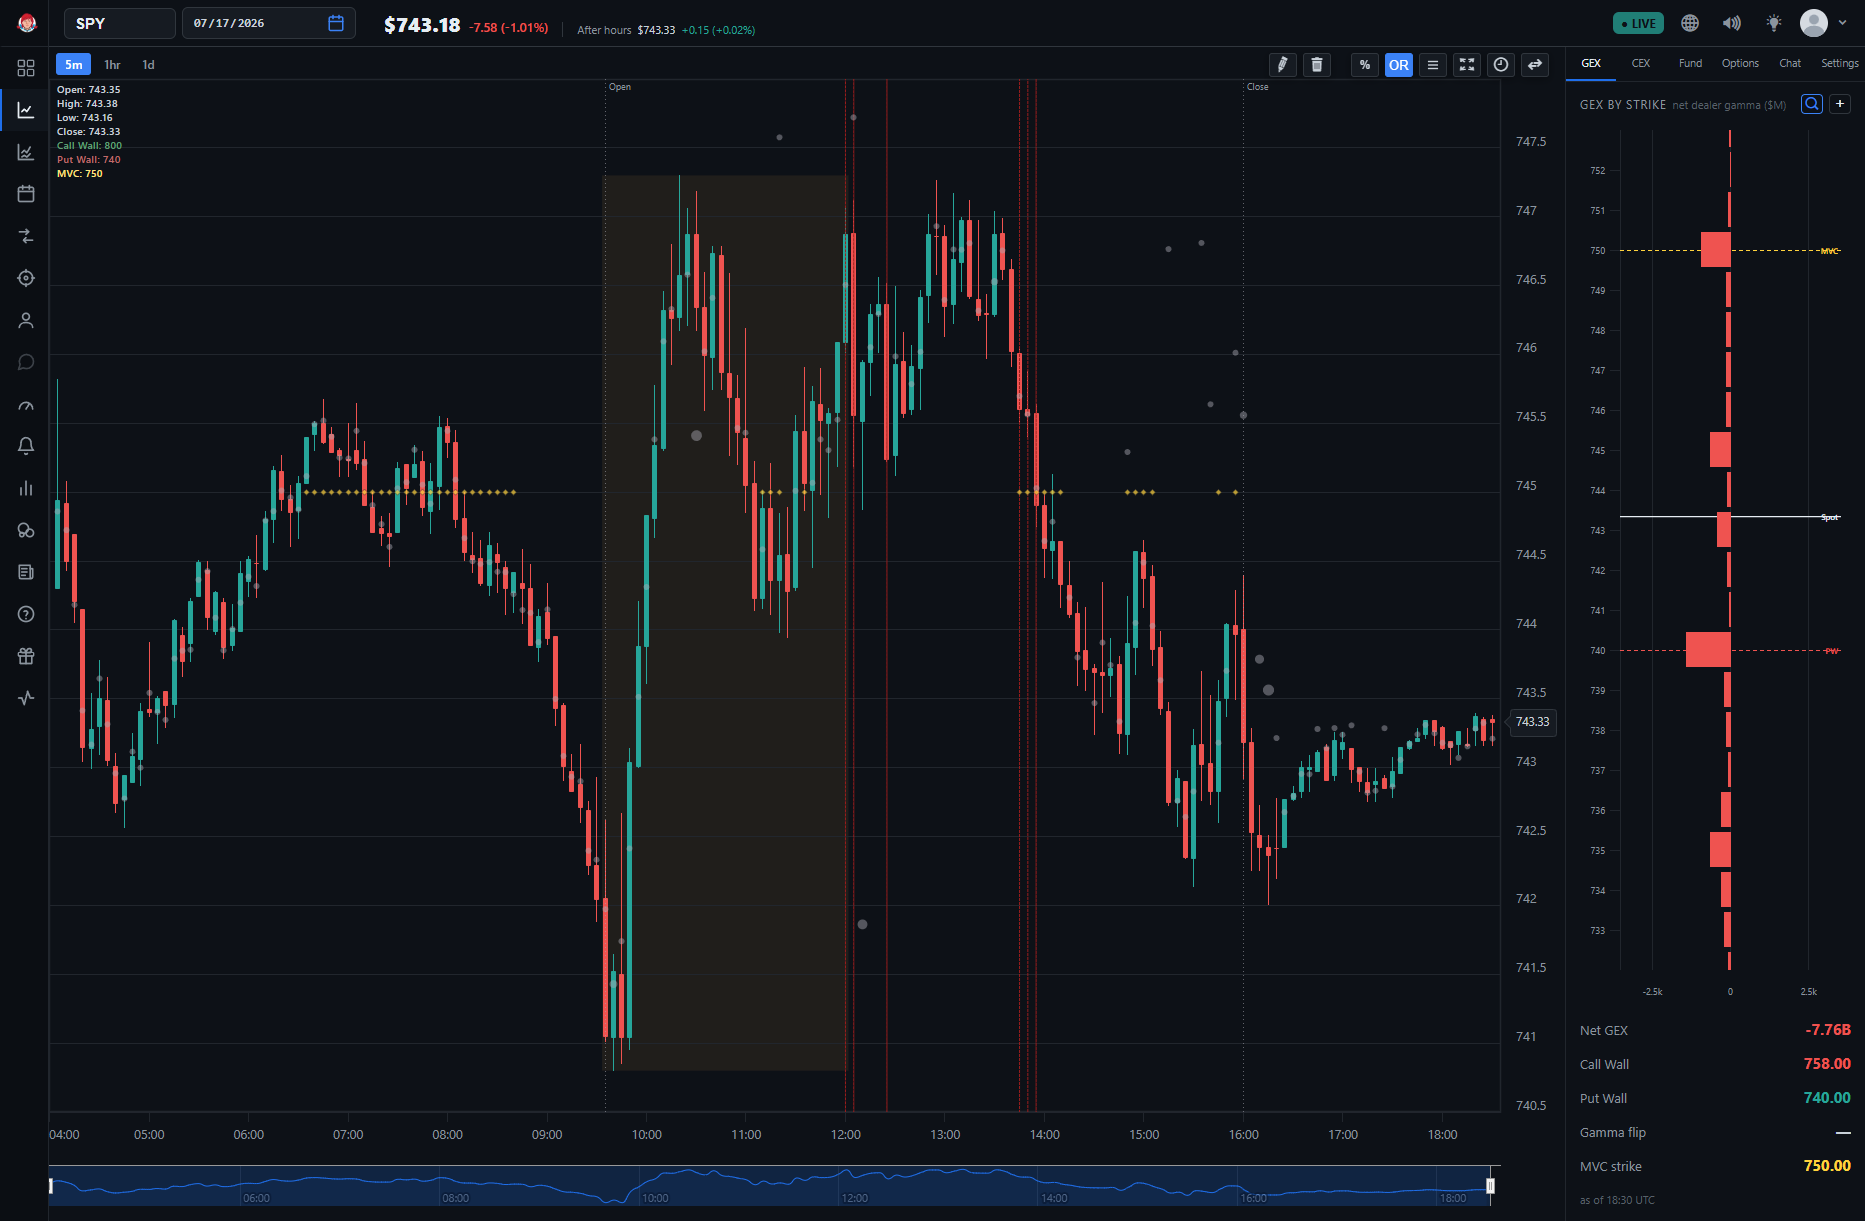
DarkPools: Reveals off-market trades that indicate institutional accumulation near support.
-
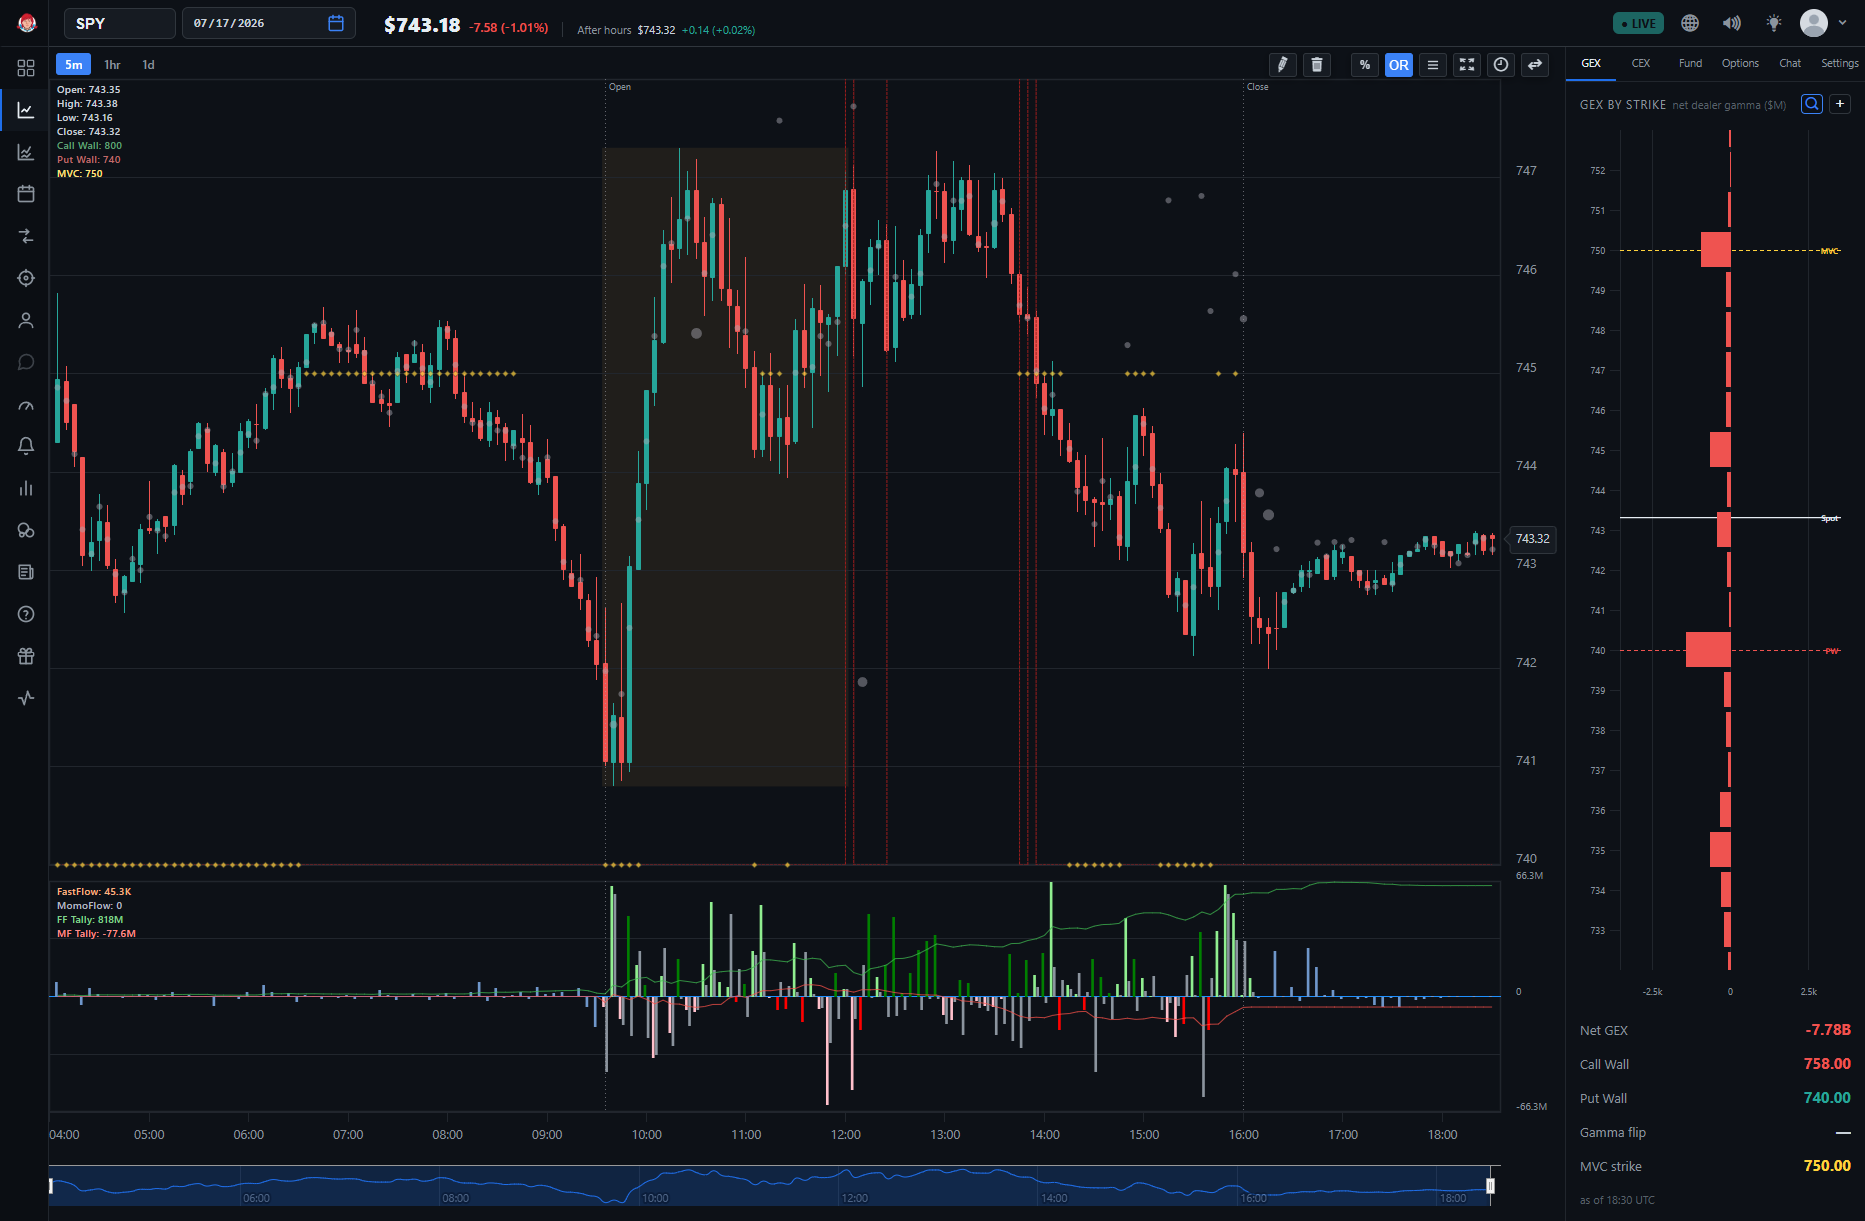
MomoFlow: Downward-pointing shadow bars mean momo is capitulating, which is bullish.
-
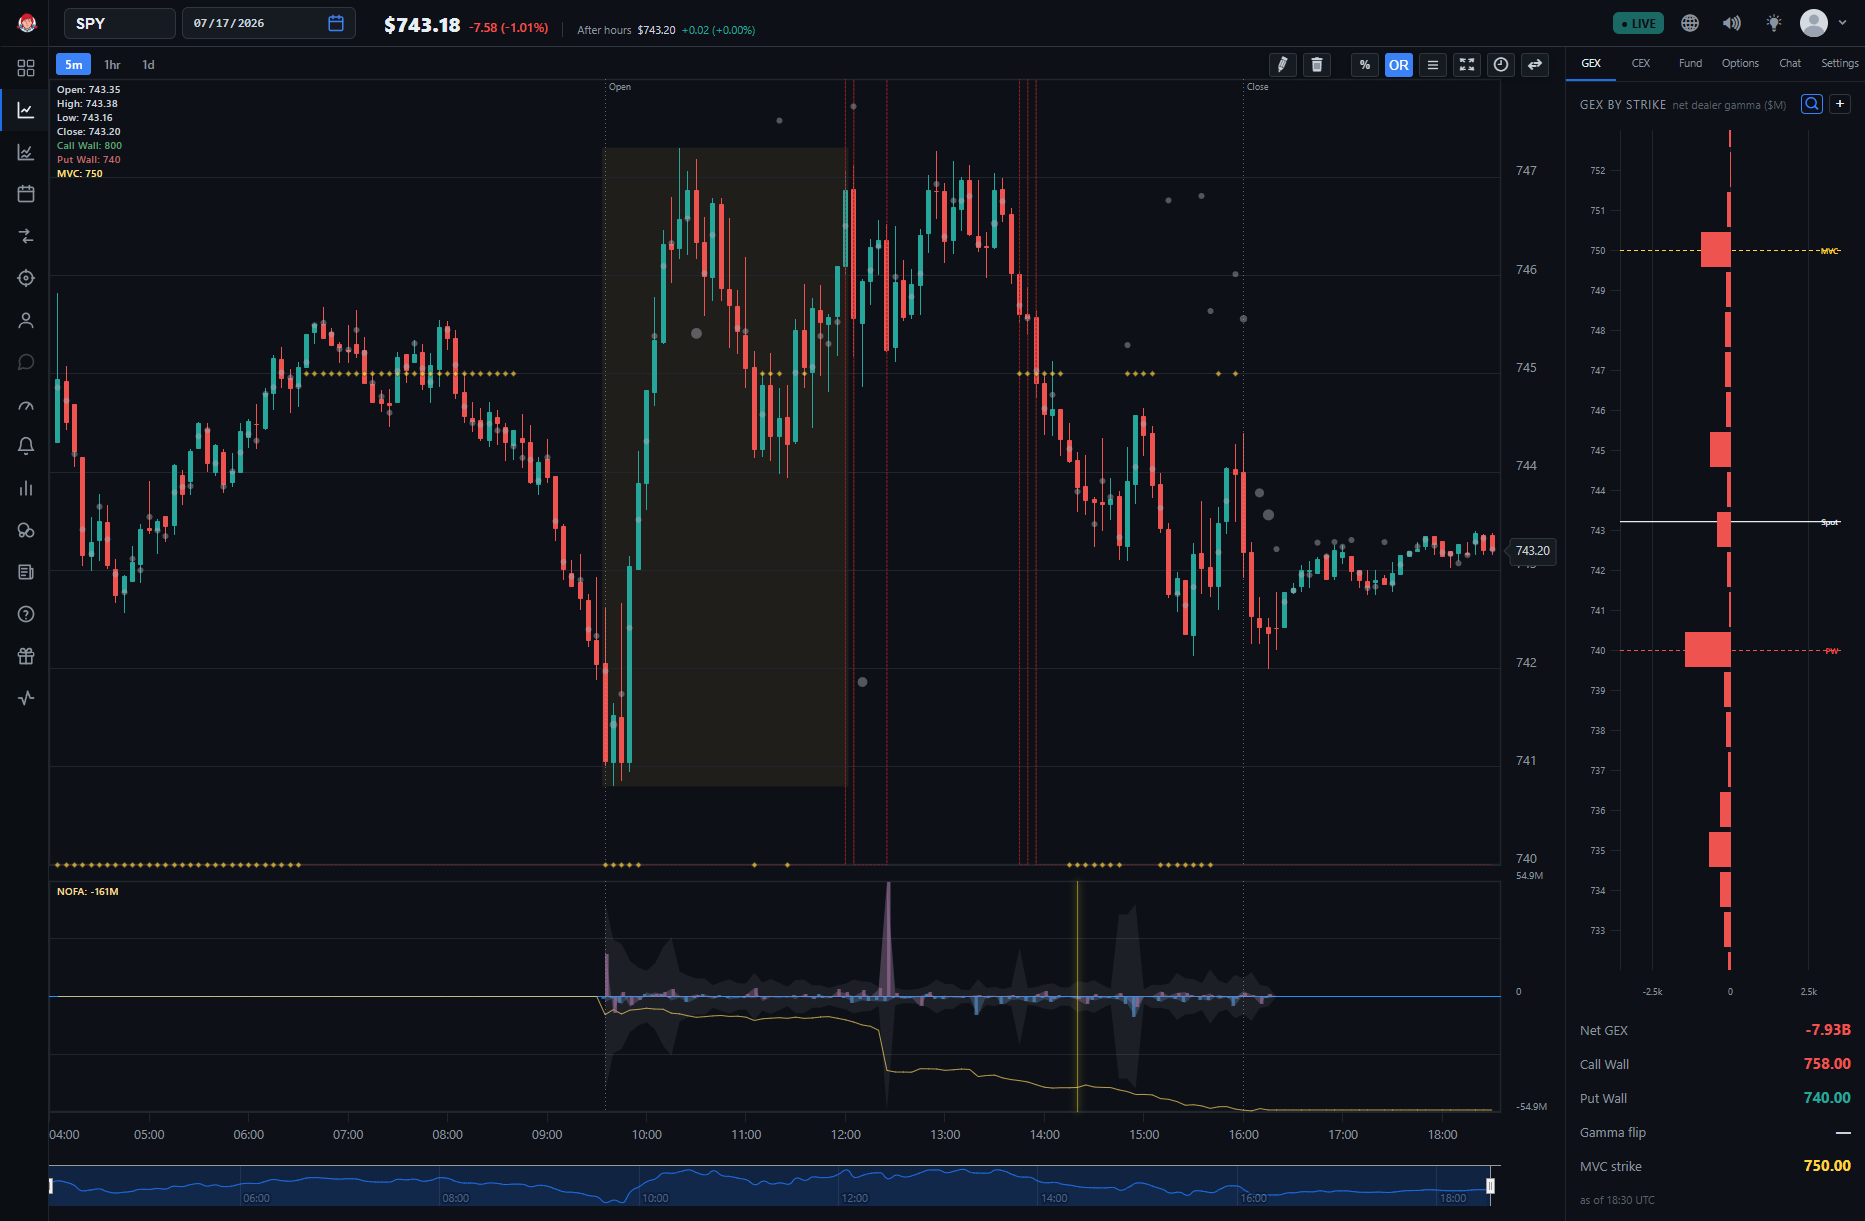
Net Options Flow: Shows exactly how much options money is supporting your trade in unusual options activity. For a bullish support bounce look for bullish net options flow right before the bounce - Large pyramids or diamonds with blue on top (call buying) and purple on bottom (put selling):
Together, these three signals tell you whether demand is actually building at the support level before price action confirms it — which is what lets you get in near the low instead of chasing the bounce after the candle has already closed.
How to Trade the Setup
Entry Point
Enter the trade once the price confirms a bounce off the support level. Look for a bullish candlestick formation accompanied by strong BigShort signals outlined above.
Stop-Loss Placement
Manage your risk by placing a stop-loss just below the support level. This protects your position in case the support fails and the price reverses downward.
Profit Target
Set an initial profit target by measuring the distance from the support level to recent resistance. As institutional indicators remain favorable, consider staying in the trade longer to capture an extended move.
Catching the Bounce Before Price Confirms It
A support level, on its own, only tells you where buyers showed up before — not whether they're still there. What Dark Pools and Net Options Flow add to a support test is timing: accumulation often builds while price is still probing the level, before any bullish candle has closed. Waiting for that candle is the cautious read, but it also means paying up for confirmation. Seeing the accumulation first is what lets you get closer to the actual low.
- Head and Shoulders Patterns — another BigShort pattern strategy
- Net Option Flow — for breakout confirmation
- Understanding Dark Pools and DarkFlow — institutional flow signals