Trading Ascending and Descending Triangles with BigShort
Introduction
Unlike a Head and Shoulders top or a support test, a triangle doesn't come with a built-in directional bias — price can resolve up or down, and much of this pattern's reputation for trapping traders comes from guessing that direction wrong. This guide covers how to spot ascending and descending triangles, and how DarkPools, MomoFlow, FastFlow, and NOF can show you which way institutional money is leaning before the breakout happens.
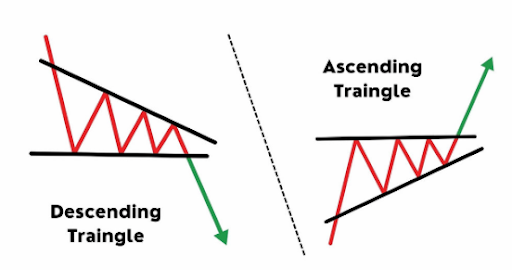
What Is a Triangle Breakout?
Triangle patterns form as the price consolidates between converging trendlines. An ascending triangle indicates bullish pressure, while a descending triangle suggests bearish pressure. A breakout from these triangles often leads to a large price move that can be traded.
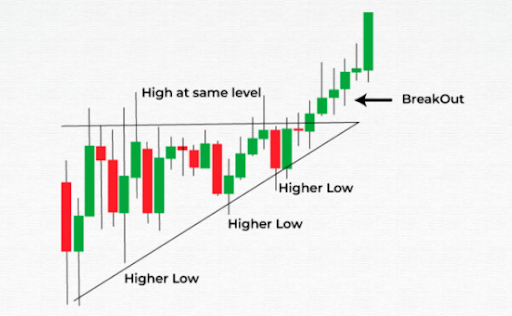
How to Identify the Setup - Ascending Triangle
Draw the Trendlines
Identify converging trendlines to form the triangle.
Note the horizontal
An Ascending Triangle is formed from a horizontal top and an ascending bottom connecting the higher lows. This is critical and differentiates the ascending triangle from the bearish rising wedge pattern.
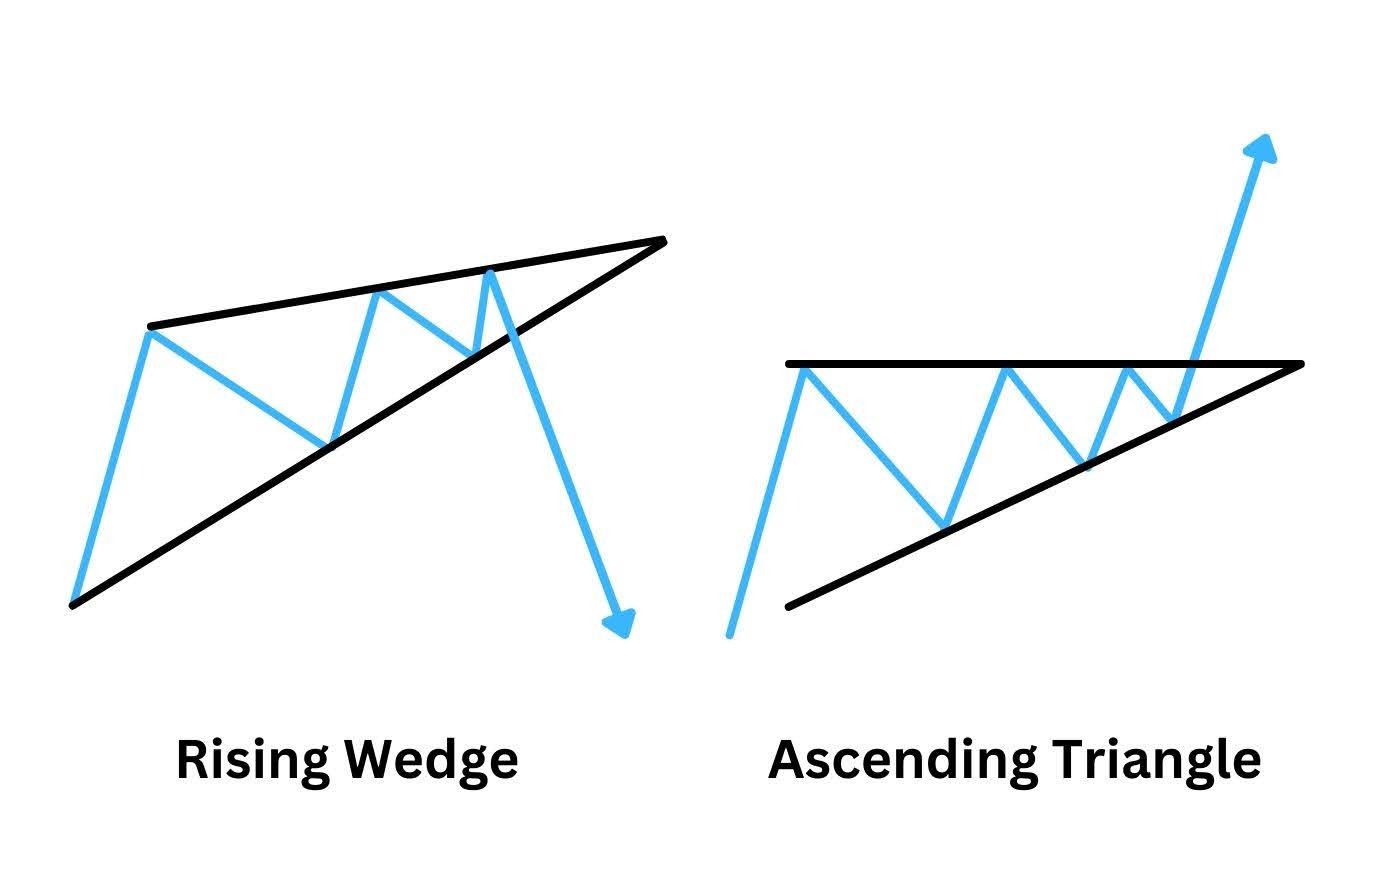
Monitor the Squeeze
Observe the narrowing price range as the triangle forms. As the price gets closer to the right end of the triangle, the stock is more likely to breakout.
BigShort Provides Advanced Warning
BigShort lets you see, in advance of the breakout, whether institutions are participating — giving you real confidence in your entry.
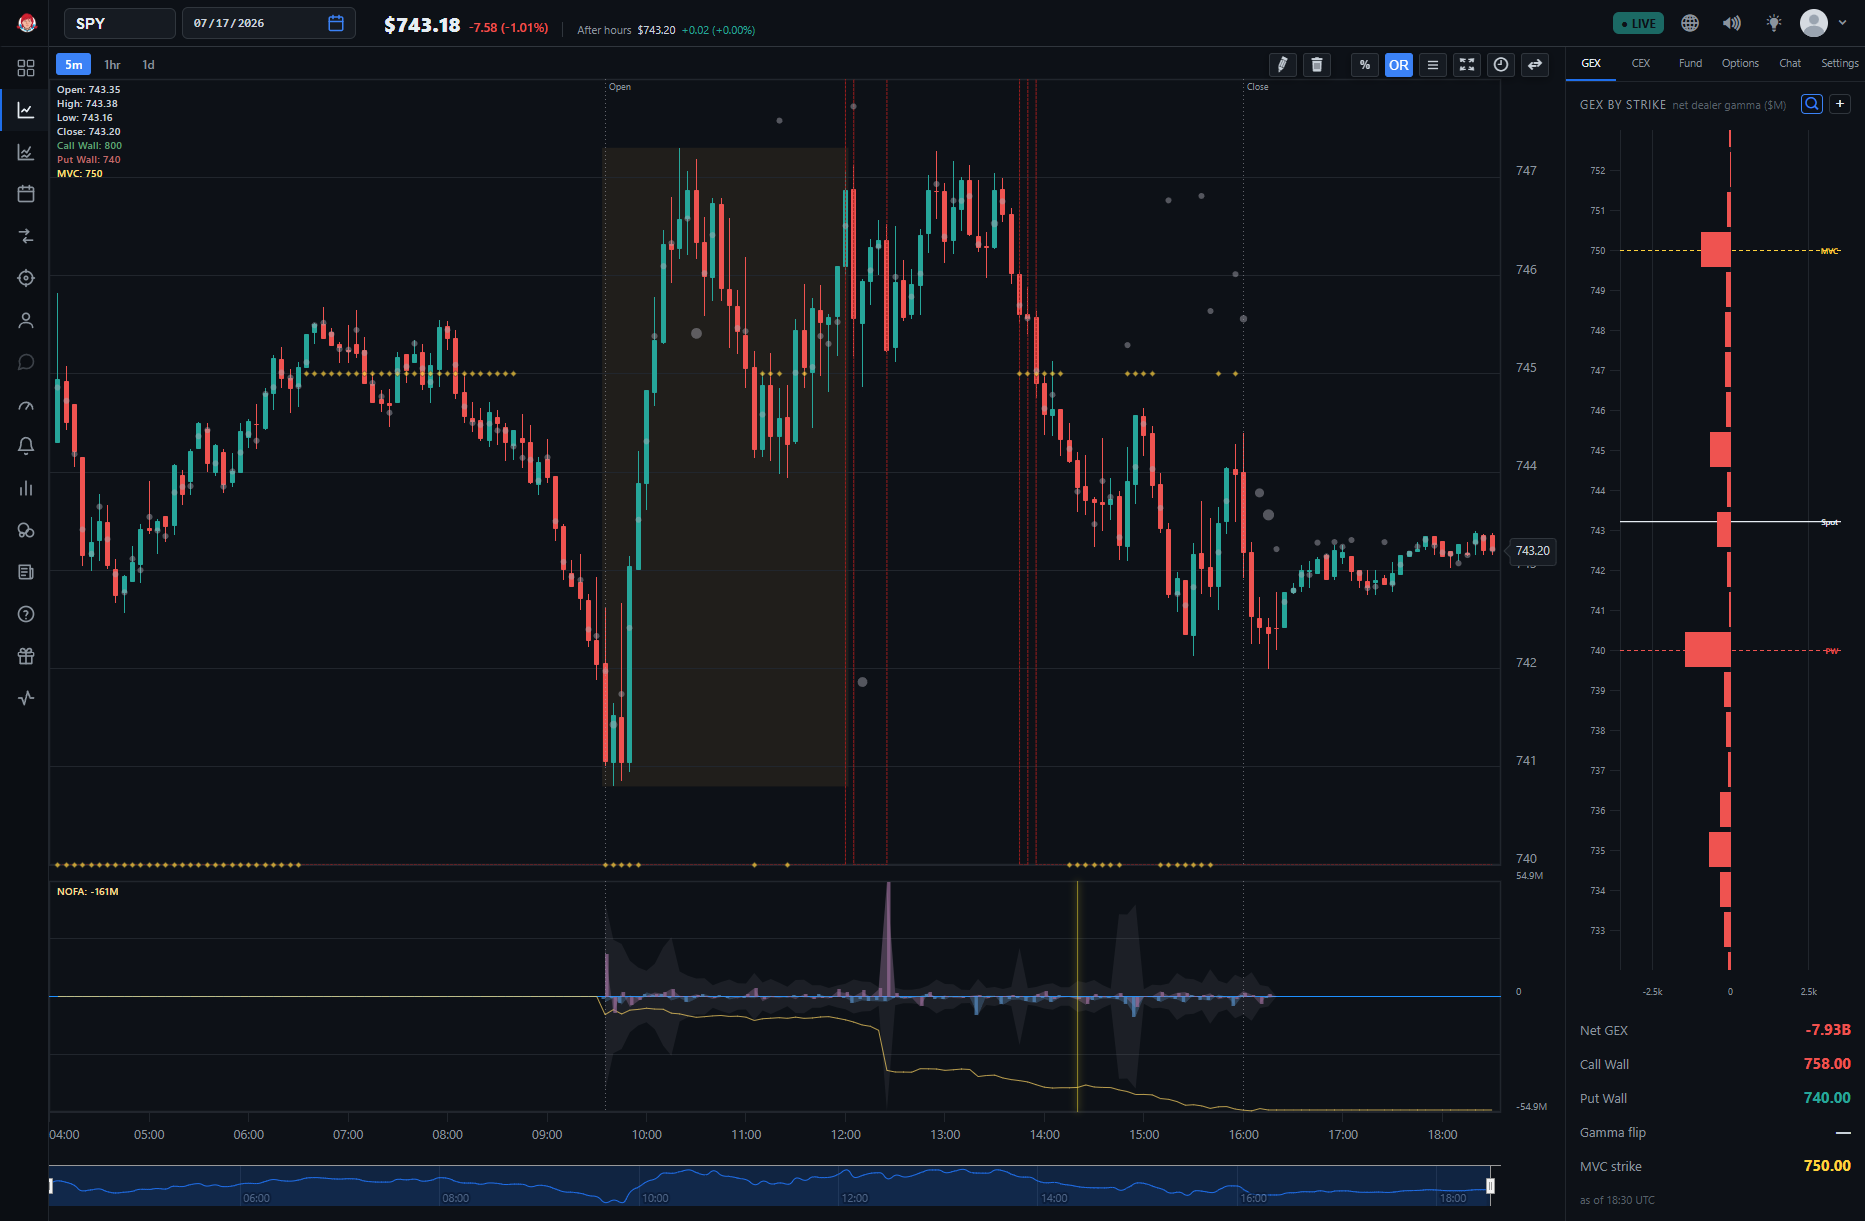
Use increasing Net Options Flow to identify an increase in bullish options buying. Note the increase in large blue upward-pointing triangles, which indicates call buying (bullish), as well as the rising green line.
Staying in the Trade
If Dark Pools (red oval, below) are present below the breakout, consider staying in the trade until the indicators begin to flip. Dark Pools signify off-market trades below the price and are strong bullish signals when they appear in groups or in size.
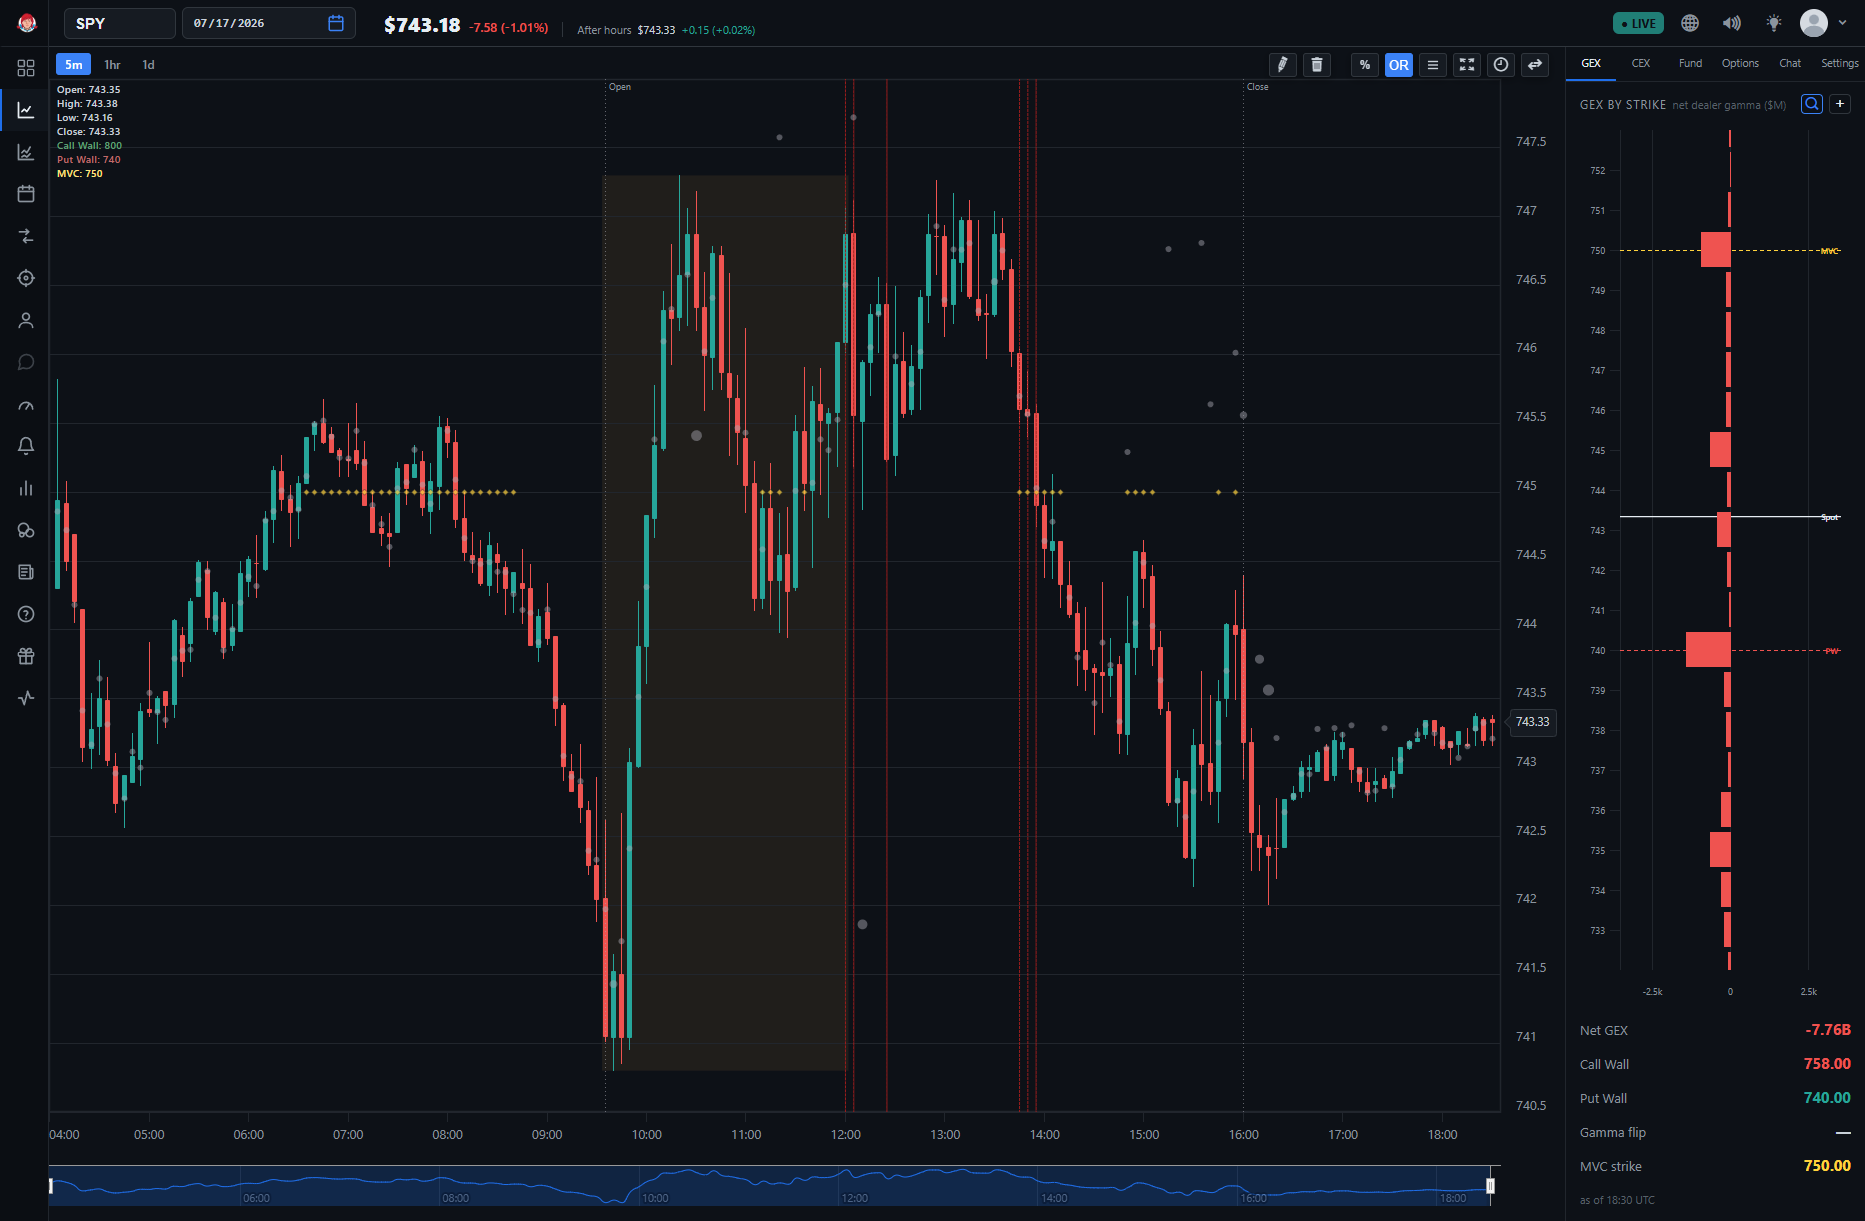
That combination — dark pool support plus a flip in the signal — is what turns the exit from a guess into something you can actually see on the chart.
Descending Triangles
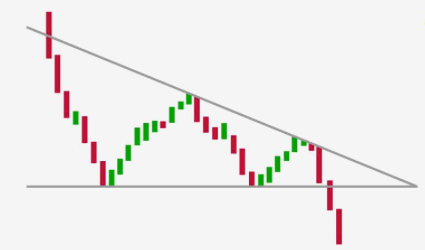
Reverse the above signals and directions to trade a descending triangle (bearish) pattern.
How to Trade the Setup
Entry Point: Enter as soon as the price breaks out of the triangle, confirmed by Momo, FF, and NOF signals.
Stop-Loss Placement: Place your stop-loss just inside the triangle to manage risk.
Profit Target: Project your initial target by measuring the triangle's height, but let the institutional activity and market sentiment visible in BigShort keep you in the trade even longer if big money is supporting it.
Resolving the Breakout Direction Early
A triangle is ambiguous by design — nothing about the shape itself tells you which way it will break. What DarkPools, MomoFlow, FastFlow, and NOF add is directional information ahead of the apex: rising call buying points to which side of the squeeze is building pressure, and dark pool prints under the price during an advance point to accumulation rather than distribution. That's a different job than confirming a reversal or a bounce — it's resolving an ambiguous setup before the chart resolves it for you.